Blank Scatter Plot
This sample shows the Scatter Plot without missing categories. It’s very important to no miss the data, because this can have the grave negative consequences. The data on the Scatter Chart are represented as points with two values of variables in the Cartesian coordinates. This sample can be used in the engineering, business, statistics, analytics, at the creating the financial and other types of reports.Donut Chart Templates
These donut chart templates was designed using ConceptDraw DIAGRAM diagramming and vector drawing software extended with Pie Charts solution from Graphs and Charts area of ConceptDraw Solution Park. All these donut chart templates are included in the Pie Charts solution. You can quickly rework these examples into your own charts by simply changing displayed data, title and legend texts.HelpDesk
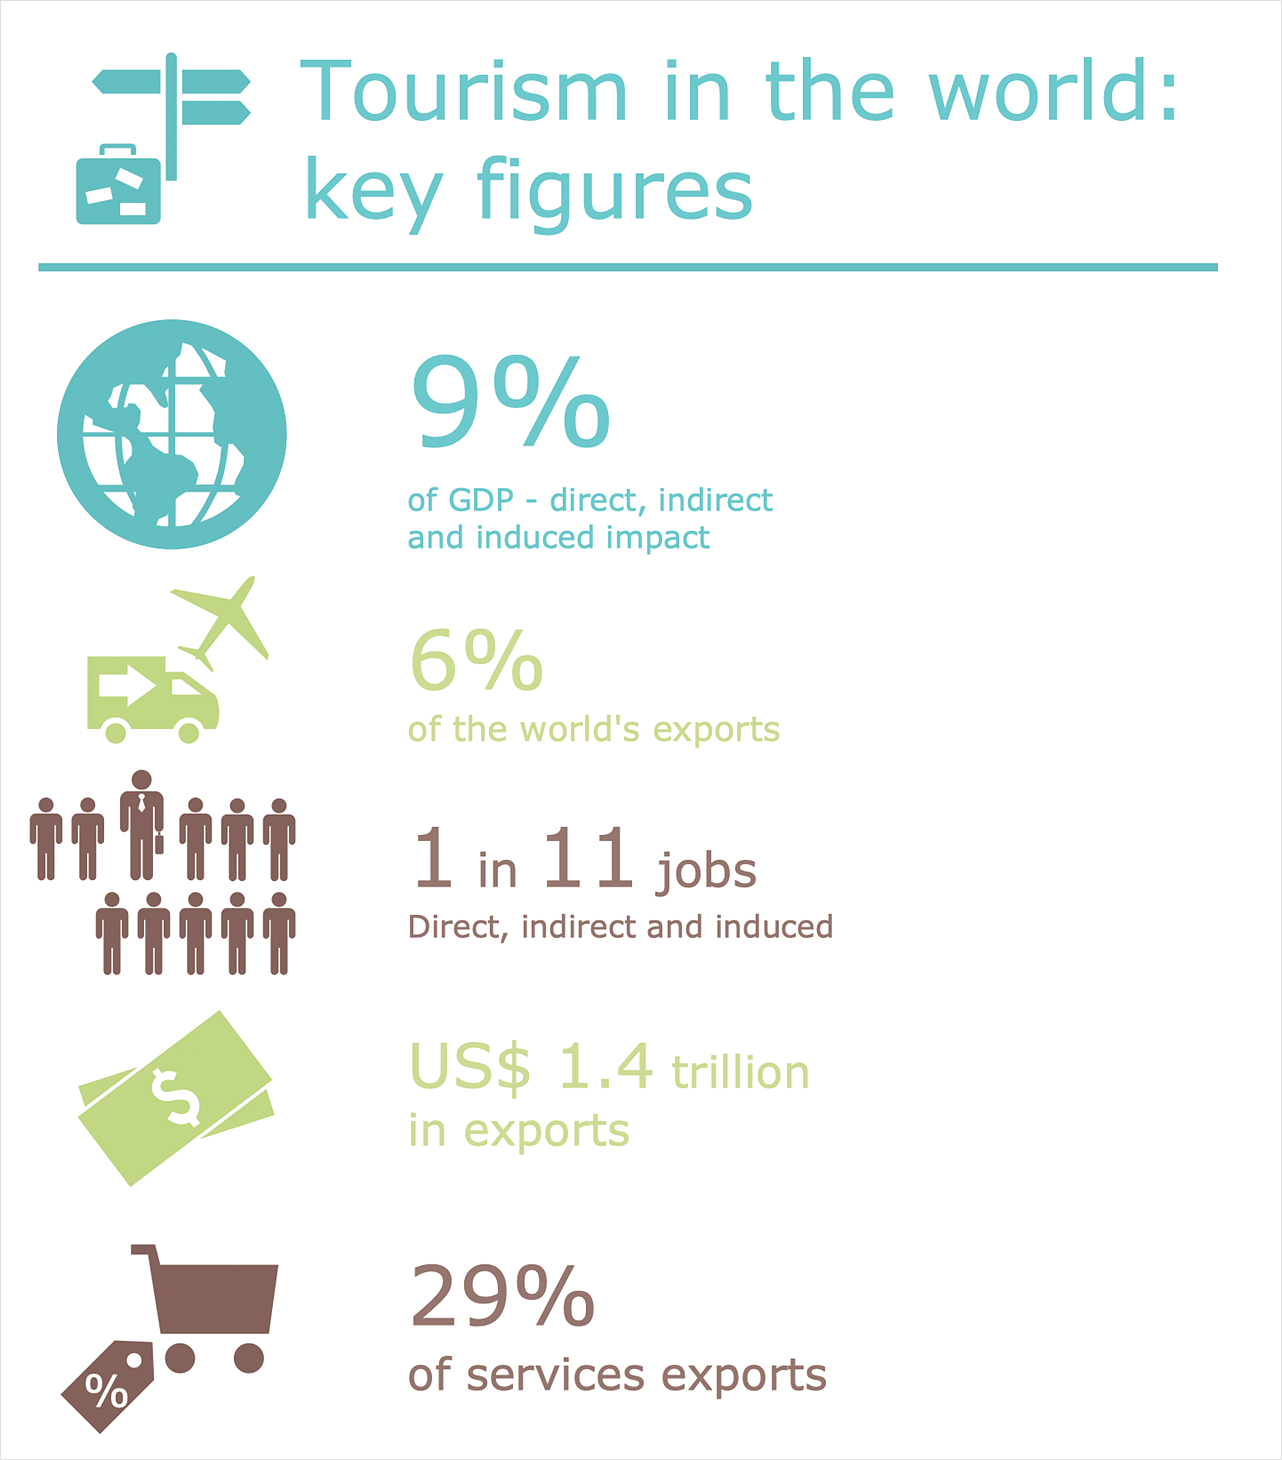
How to Draw a Pictorial Chart
Pictorial Infographics is used to visually present data comparison. Pictorial charts use relative sizes or repetitions of the same icon, picture, or symbol to show data relation. Using a Pictorial chart to show business data patterns and trends will add much more efficiency to your business communications. Finding the right tool for the job can sometimes be tricky. Developing sophisticated and effective infographics can require tools that may span many different products. Fortunately, ConceptDraw DIAGRAM has everything you need to create polished Pictorial Infographics that beautifully and accurately represent your story, no matter how complex it may be.HelpDesk
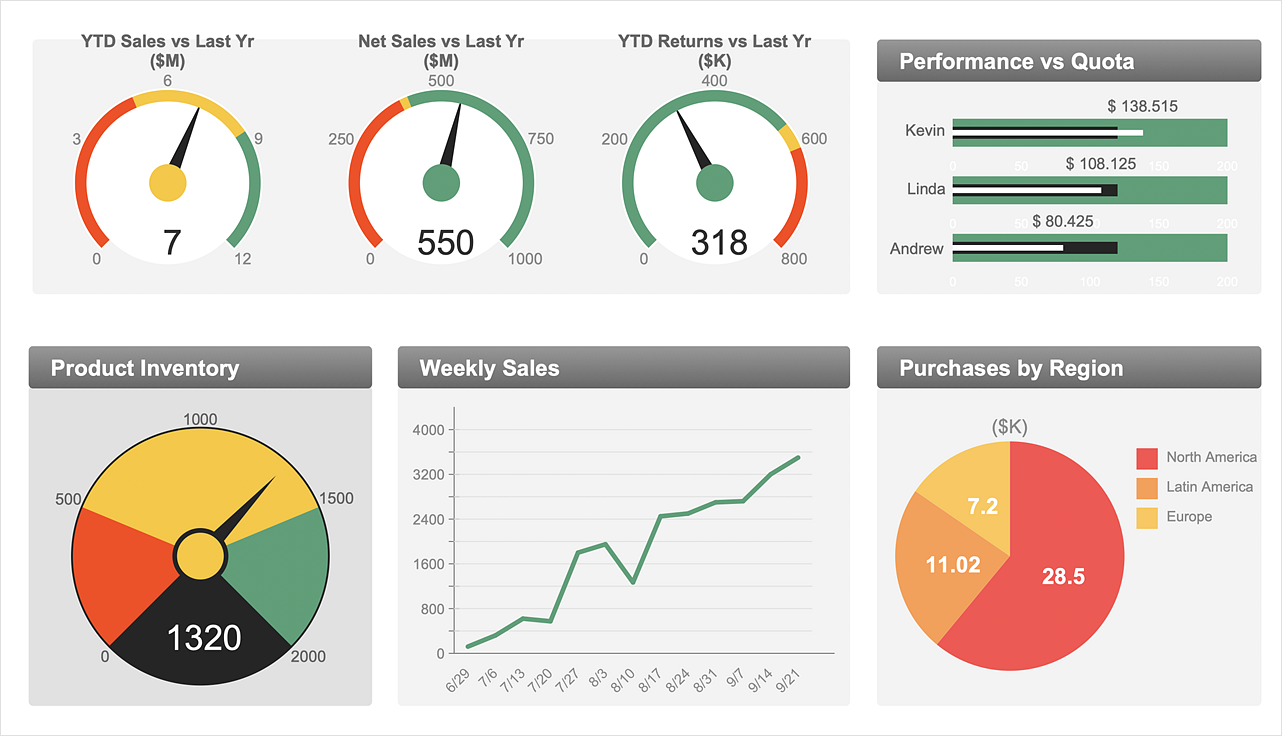
How to Use ConceptDraw Sales Dashboard Solution
An interactive visual dashboard is a valuable tool for any sales team. Sales dashboard allows you to view and monitor sales indicators that are important for manager and sales staff. It helps to use timely and reliable information to improve the quality of sales performance and increase sales revenues. ConceptDraw Sales Dashboard solution is a tool for both: sales manager and sales team. It provides the visualization of key performance indicators that are critical to the entire sales organization. The custom sales dashboard displays real-time information on sales performance KPIs with the help of intuitive and easy-to-understand diagrams and charts. Sales Dashboard helps the entire team see where they are, and what needs to be done. With ConceptDraw DIAGRAM you can easily create a visual Sales Dashboard using Live Objects Technology.Flowchart Software
Flowchart is a simple diagram, map or graphical schematic representation the sequence of actions within a process. It is ideal for displaying how a process currently flows or can function ideally. The Flowcharts let define the steps and boundaries of a process, uncover problems or miscommunications. The Flowcharts are widely used in education, software development, business, economics, thanks to their visuality they are ideal for presentations, reports, for using on conferences to help the audience comprehend the content better, or easy find flaws in a process flow diagrams. ConceptDraw DIAGRAM is professional flowcharts software and feature-rich flowchart maker, which supports Mac OS X and Windows. It contains at ConceptDraw Solution Park a rich set of stencils and professional flowchart symbols for design. It lets create simply professional-looking Flowcharts based on thousand free flowchart templates, colored symbols and examples. ConceptDraw DIAGRAM is a 3 times cheaper alternative to MS Visio available for both Mac and PC. It’s is another full featured business and technical diagramming application that can easily take care of Visio files within OS X. Another bonus with ConceptDraw DIAGRAM – it's cross-platform. You can work on a document in both OS X and Windows, skipping Visio entirely.
Technical Flow Chart Example
What illustrates a technical flow chart? Technical flow chart is a diagrammatic representation which visually illustrates the sequence of operations that must to be performed to get the problem's solution. ConceptDraw DIAGRAM enhanced with Flowcharts Solution from the "Diagrams" Area of ConceptDraw Solution is a perfect software for drawing Technical Flow Chart Example illustrating the essence and importance of the technical flow chart use.HelpDesk
How to Change the Startup Page in ConceptDraw DIAGRAM
There are several tips for the ConceptDraw DIAGRAM startup page. This article describes how to set your desired start page.SIPOC Diagram
SIPOC is a tool that summarizes the inputs and outputs of one or more processes in table form. You need to draw professional looking SIPOC Diagram quick and easy? Pay please your attention on ConceptDraw DIAGRAM diagramming and vector drawing software. Extended with Business Process Mapping Solution from the Business Processes Area of ConceptDraw Solution Park, it suits ideal for this.Blank Calendar Template
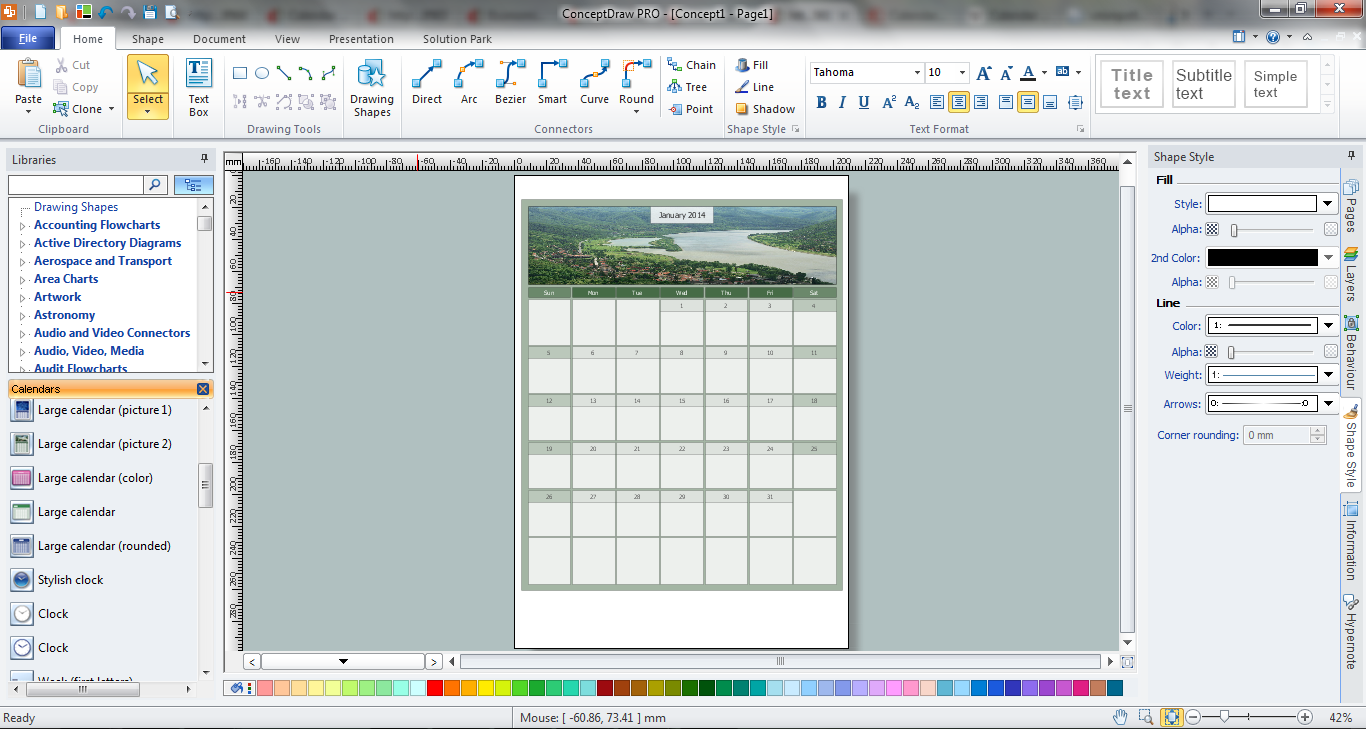
The calendars around us everywhere in the modern world. There are a lot of calendar types, each of them has its own assignment: Business calendar, Personal calendar, Economic calendar, Financial calendar, Daily calendar, Monthly calendar, and many other useful calendar types. ConceptDraw DIAGRAM offers you the possibility to make your own unique calendars on the base of the Blank Calendar Template which is included to the Calendars Solution from the Management Area.Blank Calendar
Milliard of people every day use the calendars which around us everywhere. For their creating designers apply large efforts, and also all their fantasy to make them attractive. Now we are glad to offer you the effective drawing tool - Calendars Solution from the Management Area for ConceptDraw Solution Park which contains the ready-to-use Blank Calendar shapes.Pie Chart Examples and Templates
A pie chart or a circle graph is a circular chart divided into sectors, illustrating numerical proportion. In a pie chart, the arc length of each sector and consequently its central angle and area, is proportional to the quantity it represents. Pie chart examples and templates created using ConceptDraw DIAGRAM software helps you get closer with pie charts and find pie chart examples suite your needs.HelpDesk
How to Make a Basketball Court Diagram
Basketball Court diagrams are often used as a teaching and learning tool for coaches, players and parents to describe the basketball moves and shooting drills. The ability to create Basketball diagrams with ConceptDraw DIAGRAM is contained in the Basketball solution. It provides a set of special tools for creating different Basketball diagrams. Basketball court diagram is used to describe basketball moves and shooting drills during the discussion of the match, as well as to develop a winning defense and attack strategy as a clear visual plan for future games.HelpDesk
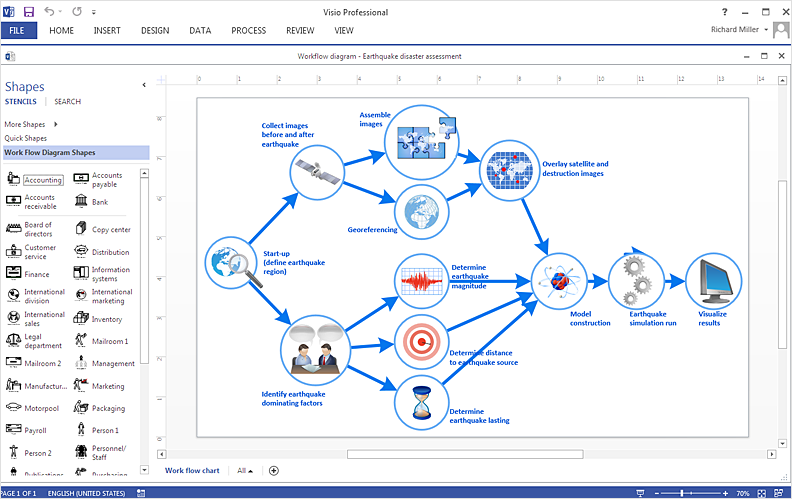
How To Create a Workflow Diagram in Visio
A workflow diagram shows a working process as a set of related events that follow each other in a particular order. They are usually created as flowcharts, with shapes that represent steps in the process connected by arrows that indicate the next step. Making a business process diagram involves many elements that can be managed using ConceptDraw DIAGRAM. The ability to design workflow diagrams is delivered by the Workflow Diagrams solution. ConceptDraw DIAGRAM allows you to easily create workflow diagrams and then make an MS Visio file from your diagrams. Using ConceptDraw DIAGRAM, you can export your workflow diagrams to MS Visio VSDX and VDX files.HelpDesk
How to Create a Mind Map on PC
Mind maps are useful forcapturing ideas, organizing and structuring information in a visual form, that is easier to understand, and easier to explain to others. Mind map consists of a general Main Idea surrounded by other related topics and subtopics, which are displayed in a radial hierarchical structure. Read this step-by-step guide on how to create a mind map using ConceptDraw MINDMAP for Windows.HelpDesk
How to Add, Move, or Delete Connection Points on PC
Few tips on how to manage connection points in ConceptDraw DIAGRAM drawings. A connection point is a special point on an object that allows one to connect a connector. You can add connection points to any object or to a blank area in your document.- Simple Blank Flow Chart
- Blank Flowchart
- Flowchart Software | Blank Scatter Plot | Spider Chart Template ...
- Blank Flow Chart
- Basic Flowchart Symbols and Meaning | MS Visio Look a Like ...
- Process Flowchart | How To use Landscape Design Software | Blank ...
- Blank Flow Chart Template
- Blank Scatter Plot | Four Dimensions Bubble Plot | Best ...
- Blank Calendar Template | Donut Chart Templates | Blank Calendar ...
- Blank Calendar Template | | Business Processes | Project ...
- Blank Calendar Template | Business Calendar | Donut Chart ...
- Blank Calendar Template | Economic Calendar | Business Calendar ...
- Blank Calendar Template | Donut Chart Templates | Blank Calendar ...
- Scatter Chart Examples | Blank Scatter Plot | Scatter Chart Analysis ...
- Blank Calendar Template | Business Calendar | Donut Chart ...
- Blank Calendar | Blank Calendar Template | Business Calendar ...
- How to Draw a Scatter Diagram | Blank Scatter Plot | Scatter Chart ...
- Economic Calendar | Blank Calendar Template | Business Calendar ...
- Scatter Diagrams | How to Draw a Scatter Diagram | Blank Scatter ...
- Blank Calendar Template | Economic Calendar | Blank Calendar ...


