HelpDesk
How to Design an Interface Mock-up of an Android Application
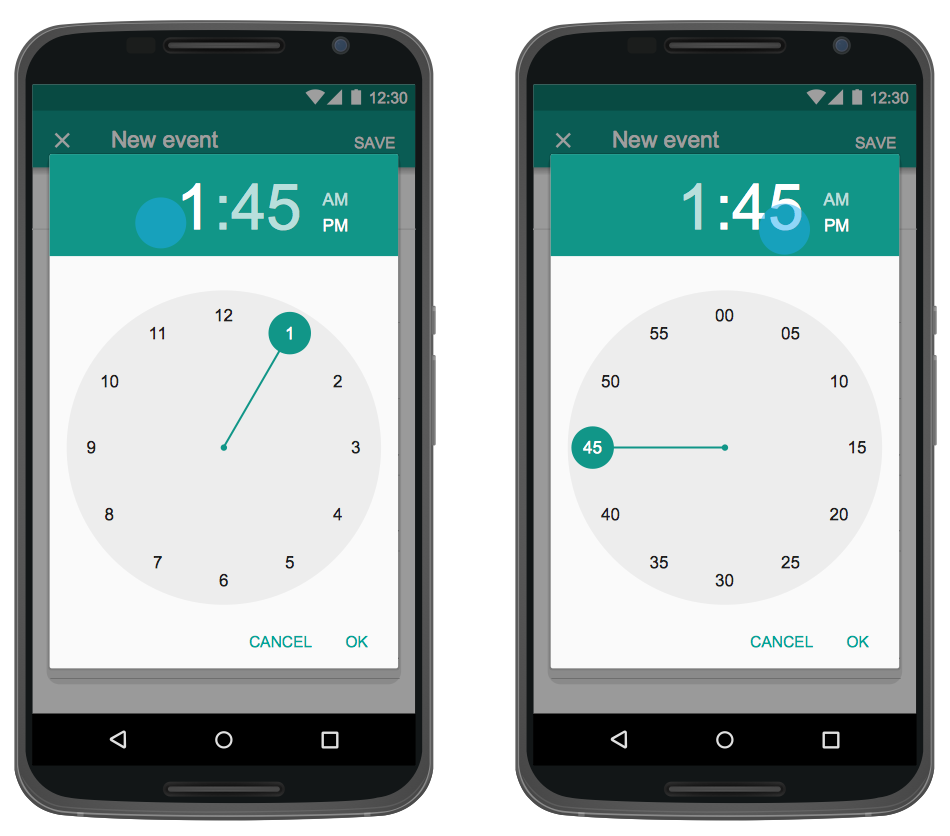
Uses Interface prototyping is much convenient when you can work through a diagram similar to the device design. ConceptDraw DIAGRAM allows you to develop Android User Interface (UI) prototypes using the special templates and vector libraries of the specific user interface elements. Using ConceptDraw DIAGRAM you can mock-up an Android UI system so that you can figure out how best to represent user interface (UI) elements for the development of a new mobile Apps.In searching of alternative to MS Visio for MAC and PC with ConceptDraw DIAGRAM
Undoubtedly MS Visio is a powerful and multifunctional tool, but however at times occur the instances, when it turns unable of meeting certain users' requirements. At this cases you may need to use an alternative program software, preferably it will be simple, convenient, and at the same time powerful and professional. In searching the alternative to MS Visio for MAC and PC we recommend you to pay attention for ConceptDraw DIAGRAM software, which was developed to satisfy all your drawing needs and requirements. It is a fully-functioned alternative product to MS Visio for both platforms. ConceptDraw DIAGRAM software has many advantages, the main among them are the cross-platform compatibility, a reasonable price, widespread ConceptDraw Solution Park with huge variety of different solutions that offer numerous libraries of specialized vector objects, useful examples, samples, and quick-start templates, extensive import / export capabilities, built-in script language, MS Visio support and certainly free technical support.Android GUI
Android is an operating system based on the Linux kernel and developed by Google for smartphones, tablet computers, electronic books, netbooks, smartbooks, digital players, watches, game consoles, TV and other devices. ConceptDraw DIAGRAM extended with Android User Interface Solution from the Software Development Area is a powerful software with extensive drawing tools which can help you to build the intelligible, attractive and easy for perception Android GUI for your application.Linux Audit Flowchart Example. Flowchart Examples
Create your own Linux audit flowcharts using the ConceptDraw DIAGRAM diagramming and vector drawing software extended with the Audit Flowcharts solution from the Finance and Accounting area of ConceptDraw Solution Park. This flowchart example describing auditd, the linux audit tool.Entity Relationship Diagram - ERD - Software for Design Crows Foot ER Diagrams
ER-model is a data model which lets describe the conceptual schemes in a specific subject area. It can help to highlight the key entities and specify relationships that can be established between these entities. During the database design, it is realized the transformation of ER model into certain database scheme based on the chosen data model (relational, object, network, etc.). There are used two notations for ERDs: Crow's Foot and Chen's. Crow's Foot notation proposed by Gordon Everest represents the entity by rectangle containing its name (name must be unique within this model), and relation - by the line which links two entities involved in relationship. The relationship's plurality is graphically indicated by a "plug" on the end of the link, the optionality - by a circle. Entity-Relationship Diagrams based on Crow's Foot notation can be easily drawn using the ConceptDraw DIAGRAM. Extended with Entity-Relationship Diagram (ERD) solution, it is the best ERD diagrams software with powerful tools and ready design elements for Crow's Foot and Chen notations.
 macOS User Interface
macOS User Interface solution extends the ConceptDraw DIAGRAM functionality with powerful GUI software graphic design features and tools. It provides an extensive range of multifarious macOS Sierra user interface design examples, samples and templates, and wide variety of libraries, containing a lot of pre-designed vector objects of Mac Apps icons, buttons, dialogs, menu bars, indicators, pointers, controls, toolbars, menus, and other elements for fast and simple designing high standard user interfaces of any complexity for new macOS Sierra.
 Fault Tree Analysis Diagrams
This solution extends ConceptDraw DIAGRAM.5 or later with templates, fault tree analysis example, samples and a library of vector design elements for drawing FTA diagrams (or negative analytical trees), cause and effect diagrams and fault tree diagrams.
- Top 5 Android Flow Chart Apps | DroidDia prime | Army Flow Charts ...
- Top 5 Android Flow Chart Apps | How to Design an Interface Mock ...
- Top 5 Android Flow Chart Apps | Army Flow Charts | Flowchart ...
- Best Flow Chart Maker
- Best Flow Chart Making Apps In Android Windows
- Top 5 Android Flow Chart Apps | How to Design an Interface Mock ...
- Give Me Best Steps For Making Android App By Flow Diagram
- Top 5 Android Flow Chart Apps | Event-driven Process Chain ...
- Flow Chart Online | Process Flowchart | Top 5 Android Flow Chart ...
- Best Android Flowchart App
- Top 5 Android Flow Chart Apps | How to Design an Interface Mock ...
- Top 5 Android Flow Chart Apps | Army Flow Charts | LLNL Flow ...
- Top 5 Android Flow Chart Apps | Flowchart by Hapman | Cubetto ...
- Create Flow Chart on Mac | Top 5 Android Flow Chart Apps ...
- Top 5 Android Flow Chart Apps | How to Design an Interface Mock ...
- Top 5 Android Flow Chart Apps | Good Flow Chart app for Mac ...
- Top 5 Android Flow Chart Apps | How to Design an Interface Mock ...
- Top 5 Android Flow Chart Apps | Cubetto Flowchart | Flow Diagram ...
- Process Flowchart | Top 5 Android Flow Chart Apps | Basic ...


_Win_Mac.png)