 Telecommunication Network Diagrams
Telecommunication Network Diagrams solution extends ConceptDraw PRO software with samples, templates, and great collection of vector stencils to help the specialists in a field of networks and telecommunications, as well as other users to create Computer systems networking and Telecommunication network diagrams for various fields, to organize the work of call centers, to design the GPRS networks and GPS navigational systems, mobile, satellite and hybrid communication networks, to construct the mobile TV networks and wireless broadband networks.
HelpDesk
How to Add a Block Diagram to a PowerPoint Presentation Using ConceptDraw PRO
A block diagram is a useful tool both in designing new processes, and in improving existing. A block diagram is a type of chart, which is often used in presentations, because of its universality - the graphic blocks can be applied to many processes.The PowerPoint presentation of major process steps and key process participants can be very informative and helpful. Using ConceptDraw PRO, you can easily convert a block diagram to MS PowerPoint presentation.
 Cisco Network Diagrams
Cisco Network Diagrams solution extends ConceptDraw PRO software with samples, templates and libraries of vector stencils for drawing the Cisco computer network diagrams.
HelpDesk
How to Draw a Block Diagram in ConceptDraw PRO
Block diagram is a simple chart that use blocks to show some elements or activities, and connectors that show the relationship between neighboring blocks. They are commonly simple, giving an overview of a process without necessarily going into the specifics of implementation. Block diagrams are commonly used to depict a general description of a system and its activity. A most known sample of a block diagram is a flow chart, used in many types of business as a common method of representing repeated processes. Easy and a simple creation, a number of objects and connectors make the block diagram a many-sided tool for various industries. The ability to make block diagrams is delivered by the ConceptDraw Block Diagrams solution.HelpDesk
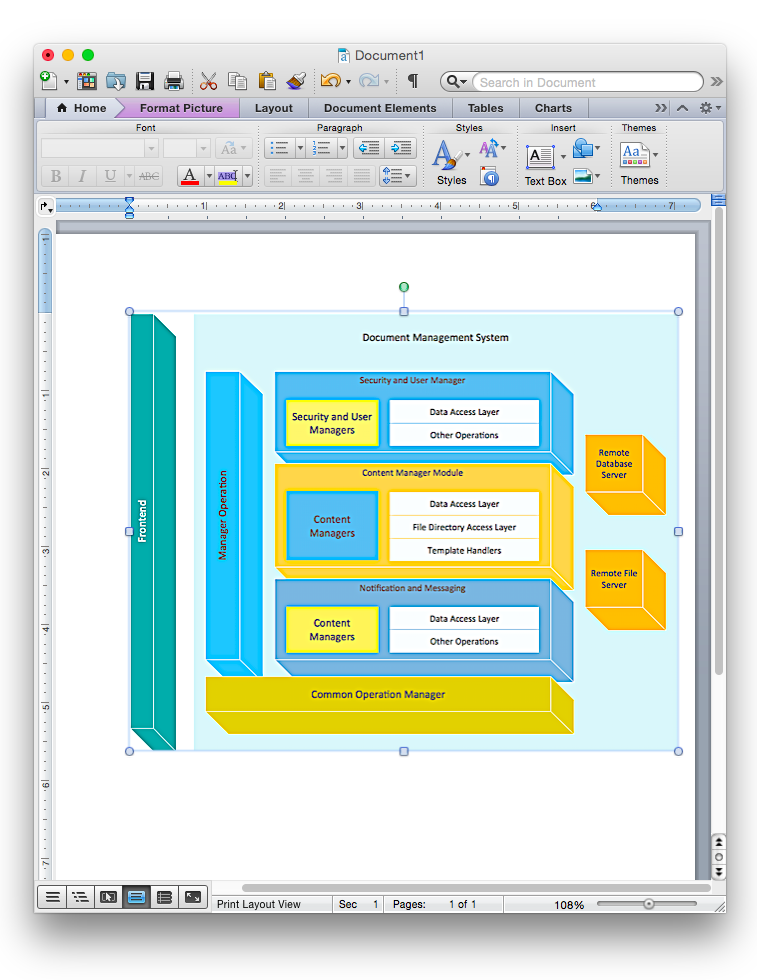
How to Add a Block Diagram to a MS Word ™ Document Using ConceptDraw PRO
Block diagram consists from graphic blocks. Blocks are connected by lines or arrows. Block diagrams are used to show the relationship between parts of some systems. It can be used for the development of new systems or to improve existing ones. The structure of block diagram gives a high-level overview of the major components of the system, as well as the important relationships. Using the block diagrams, you can more effectively present the business data contained in your MS Word documents. ConceptDraw PRO allows you to easily create block diagrams and then insert them into a MS Word document.
 Computer Network Diagrams
Computer Network Diagrams solution extends ConceptDraw PRO software with samples, templates and libraries of vector icons and objects of computer network devices and network components to help you create professional-looking Computer Network Diagrams, to plan simple home networks and complex computer network configurations for large buildings, to represent their schemes in a comprehensible graphical view, to document computer networks configurations, to depict the interactions between network's components, the used protocols and topologies, to represent physical and logical network structures, to compare visually different topologies and to depict their combinations, to represent in details the network structure with help of schemes, to study and analyze the network configurations, to communicate effectively to engineers, stakeholders and end-users, to track network working and troubleshoot, if necessary.
- Basic CCTV System Diagram . CCTV Network Diagram Example ...
- Basic Block Diagram Of Wirless Communication
- Block Diagram Of Wired Lan
- Basic Block Diagram Of Telecommunication Network
- Block Diagram Of Computer Examples
- Basic Network Diagram | Active Directory Diagram | Network Layout ...
- Wireless Networks | Building Plans Area | Wifi Basic Block Diagram
- Block Diagram Of Network
- UML Block Diagram | Telecommunication Network Diagrams | Basic ...
- Wireless Networks | Basic Network Diagram | Building Plans Area ...
- Block Diagram Of The Basic Elements Of A Telecommunication
- UML Block Diagram | Telecommunication Network Diagrams ...
- Basic Network Diagram | Telecommunication Network Diagrams ...
- Block Diagram Of Basic Networking Elements
- Functional Block Diagram | UML Flowchart Symbols ...
- Block Diagram Of Basic Elements Of Network
- Basic Block Diagram Of Gps System
- Basic Block Diagram Of Broadband Wirless Network
- Block Diagrams | Basic Diagramming | Business Diagram Software ...
- Diagram of a Basic Computer Network . Computer Network Diagram ...


