The vector stencils library "Picture Graphs" contains 35 templates of picture bar graphs for visual data comparison and time series.
Drag a template from the library to your document, set bars number, type category labels, select bars and enter your data.
Use these shapes to draw your pictorial bar charts in the ConceptDraw PRO diagramming and vector drawing software.
The vector stencils library "Picture Graphs" is included in the Picture Graphs solution from the Graphs and Charts area of ConceptDraw Solution Park.
Arrow
Water drop

Food

Grain

Agriculture

Medicines

Houses

Buildings

Money bags

Oil barrels

Natural gas

Electrical power

Nuclear power

Mechanical engineering

Chemical industry

Mining

Gold bars

Coins

Person

Men, women and children

Man

Woman

Child

Milk

Meat

Fruits

Vegetables

Computer

Mobile phone

Airliner

Car

Bus

Truck

Train

Cargo ship

Bar Diagrams for Problem Solving. Create economics and financial bar charts with Bar Graphs Solution

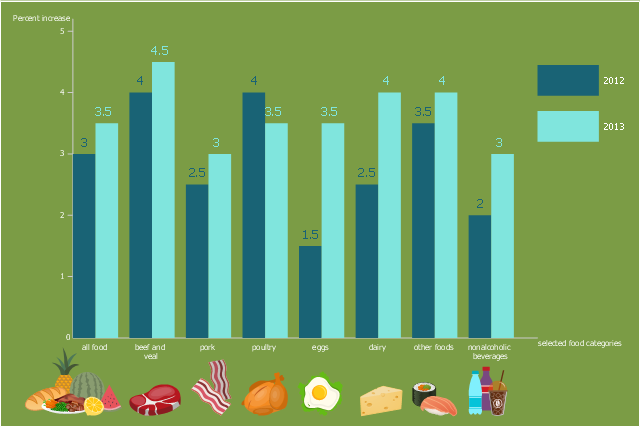
This double bar chart sample shows the forecasted impacts of 2012 drought expected to be larger in 2013 for most foods. It was designed in the base of the graph from the webpage "Price impacts of 2012 drought expected to be larger in 2013 for most foods" on the website of the United States Department of Agriculture Economic Research Service. [ers.usda.gov/ data-products/ chart-gallery/ detail.aspx?chartId=29456&ref=collection#.Ue5MMaxad5I]
"A price index (plural: “price indices” or “price indexes”) is a normalized average (typically a weighted average) of price relatives for a given class of goods or services in a given region, during a given interval of time. It is a statistic designed to help to compare how these price relatives, taken as a whole, differ between time periods or geographical locations.
Price indexes have several potential uses. For particularly broad indices, the index can be said to measure the economy's general price level or a cost of living. More narrow price indices can help producers with business plans and pricing. Sometimes, they can be useful in helping to guide investment." [Price index. Wikipedia]
The column chart example "Changes in price indices" was created using the ConceptDraw PRO diagramming and vector drawing software extended with the Bar Graphs solution from the Graphs and Charts area of ConceptDraw Solution Park.
Double bar graph
The vector stencils library "Picture Graphs" contains 35 templates of picture bar graphs for visual data comparison and time series.
Drag a template from the library to your document, set bars number, type category labels, select bars and enter your data.
Use these shapes to draw your pictorial bar charts in the ConceptDraw PRO diagramming and vector drawing software.
The vector stencils library "Picture Graphs" is included in the Picture Graphs solution from the Graphs and Charts area of ConceptDraw Solution Park.
Drag a template from the library to your document, set bars number, type category labels, select bars and enter your data.
Use these shapes to draw your pictorial bar charts in the ConceptDraw PRO diagramming and vector drawing software.
The vector stencils library "Picture Graphs" is included in the Picture Graphs solution from the Graphs and Charts area of ConceptDraw Solution Park.
Arrow
Water drop
Food
Grain
Agriculture
Medicines
Houses
Buildings
Money bags
Oil barrels
Natural gas
Electrical power
Nuclear power
Mechanical engineering
Chemical industry
Mining
Gold bars
Coins
Person
Men, women and children
Man
Woman
Child
Milk
Meat
Fruits
Vegetables
Computer
Mobile phone
Airliner
Car
Bus
Truck
Train
Cargo ship
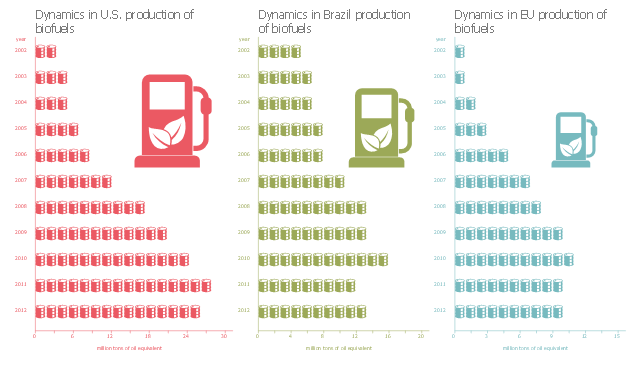
This picture bar graph sample shows biofuels production dynamics in U.S., Brazil and EU from 2002 to 2012. It was designed on the base of the Wikimedia Commons file: Production of biofuels.jpg.
[commons.wikimedia.org/ wiki/ File:Production_ of_ biofuels.jpg]
This file is made available under the Creative Commons CC0 1.0 Universal Public Domain Dedication. [creativecommons.org/ publicdomain/ zero/ 1.0/ deed.en]
"A biofuel is a fuel that is produced through contemporary biological processes, such as agriculture and anaerobic digestion, rather than a fuel produced by geological processes such as those involved in the formation of fossil fuels, such as coal and petroleum, from prehistoric biological matter. Biofuels can be derived directly from plants, or indirectly from agricultural, commercial, domestic, and/ or industrial wastes. Renewable biofuels generally involve contemporary carbon fixation, such as those that occur in plants or microalgae through the process of photosynthesis. Other renewable biofuels are made through the use or conversion of biomass (referring to recently living organisms, most often referring to plants or plant-derived materials). This biomass can be converted to convenient energy-containing substances in three different ways: thermal conversion, chemical conversion, and biochemical conversion. This biomass conversion can result in fuel in solid, liquid, or gas form. This new biomass can also be used directly for biofuels." [Biofuel. Wikipedia]
The pictorial chart example "Production of biofuels" was created using the ConceptDraw PRO diagramming and vector drawing software extended with the Picture Graphs solution from the Graphs and Charts area of ConceptDraw Solution Park.
Image chart
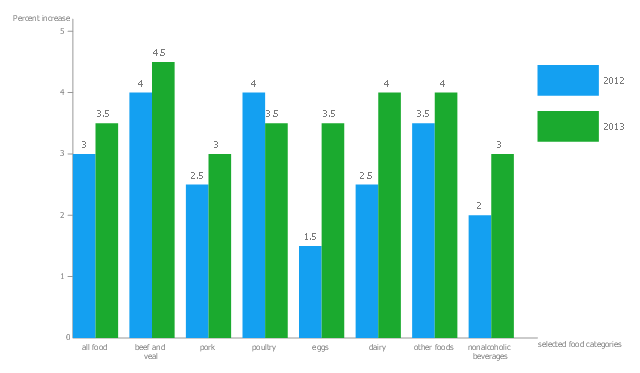
This two series column chart sample shows the forecasted changes in price indices for selected food categories in 2012 and 2013. It was designed on the base of the bar graph on the webpage "Price impacts of 2012 drought expected to be larger in 2013 for most foods" from the website of the United States Department of Agriculture Economic Research Service. [ers.usda.gov/ data-products/ chart-gallery/ detail.aspx?chartId=29456&ref=collection#.Ue5MMaxad5I]
"A price index (plural: “price indices” or “price indexes”) is a normalized average (typically a weighted average) of price relatives for a given class of goods or services in a given region, during a given interval of time. It is a statistic designed to help to compare how these price relatives, taken as a whole, differ between time periods or geographical locations.
Price indexes have several potential uses. For particularly broad indices, the index can be said to measure the economy's general price level or a cost of living. More narrow price indices can help producers with business plans and pricing. Sometimes, they can be useful in helping to guide investment." [Price index. Wikipedia]
The double bar chart example "Changes in price indices" was created using the ConceptDraw PRO diagramming and vector drawing software extended with the Basic Bar Graphs solution from the Graphs and Charts area of ConceptDraw Solution Park.
Double bar graph
 Marketing Diagrams
Marketing Diagrams solution extends ConceptDraw DIAGRAM diagramming software with abundance of samples, templates and vector design elements intended for easy graphical visualization and drawing different types of Marketing diagrams and graphs, including Branding Strategies Diagram, Five Forces Model Diagram, Decision Tree Diagram, Puzzle Diagram, Step Diagram, Process Chart, Strategy Map, Funnel Diagram, Value Chain Diagram, Ladder of Customer Loyalty Diagram, Leaky Bucket Diagram, Promotional Mix Diagram, Service-Goods Continuum Diagram, Six Markets Model Diagram, Sources of Customer Satisfaction Diagram, etc. Analyze effectively the marketing activity of your company and apply the optimal marketing methods with ConceptDraw DIAGRAM software.
Geo Map — USA — Montana

Bar Chart Template for Word

Bar Diagrams for Problem Solving. Create manufacturing and economics bar charts with Bar Graphs Solution

- Bar Chart Of Agriculture Production In India
- Bar Diagram In Agriculture Examples
- Area Charts | Bar Graph Of Agriculture In India
- Flow chart Example. Warehouse Flowchart | Bar Diagrams for ...
- Area Charts | Education Package | Bar Graph Of Indian Agriculture
- Area Charts | Pie Charts Of Agriculture In India
- Bar Graph On Agriculture
- Bar Diagrams for Problem Solving. Create economics and financial ...
- Area Charts | Bar Garph Chart Of Crop Production In India
- Draw The Chart Of Agriculture