 Bar Graphs
The Bar Graphs solution enhances ConceptDraw PRO v10 functionality with templates, numerous professional-looking samples, and a library of vector stencils for drawing different types of Bar Graphs, such as Simple Bar Graph, Double Bar Graph, Divided Bar Graph, Horizontal Bar Graph, Vertical Bar Graph, and Column Bar Chart.
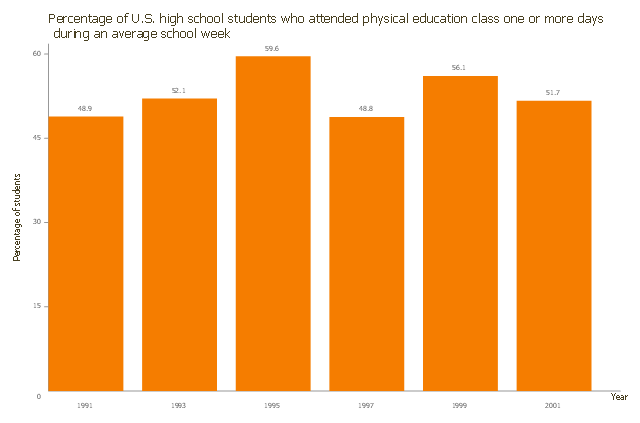
This vertical bar chart sample shows the percentage of U.S. high school students. It was designed on the base of the bar graph from the article "Childhood Obesity — What We Can Learn From Existing Data on Societal Trends, Part 2" on the U.S. Centers for Disease Control and Prevention (CDC) website.
[cdc.gov/ pcd/ issues/ 2005/ apr/ 04_ 0039.htm]
"Childhood obesity is a condition where excess body fat negatively affects a child's health or well-being. As methods to determine body fat directly are difficult, the diagnosis of obesity is often based on BMI. Due to the rising prevalence of obesity in children and its many adverse health effects it is being recognized as a serious public health concern." [Childhood obesity. Wikipedia]
The column chart example "Percentage of U.S. high school students" was created using the ConceptDraw PRO diagramming and vector drawing software extended with the Bar Graphs solution from the Graphs and Charts area of ConceptDraw Solution Park.
Column chart
Bar Chart Template

Chart Maker for Presentations

Column Chart Examples

Flow Chart Symbols

 School and Training Plans
Planning a school and its campus layout needs to depict the premises, represent internal spaces, location of windows and direction of natural light. Detailed classroom seating chart helps you visualize location of the blackboard and desks, taking into account the specifics of the room and its lighting, with a goal to design the classroom to be comfortable for each pupil and teacher.
 Line Graphs
How to draw a Line Graph with ease? The Line Graphs solution extends the capabilities of ConceptDraw PRO v10 with professionally designed templates, samples, and a library of vector stencils for drawing perfect Line Graphs.
Interior Design School Layout - Design Elements

Use the Best FlowChart Tool for the Job

- Software development with ConceptDraw PRO | Bar Graphs | Draw ...
- Bar Graphs | Data-driven charts - Vector stencils library | Chart ...
- School and Training Plans | Logistics Flow Charts | Bar Graphs ...
- Percent of Students achieved a 36 on ACT | Percentage of U.S. high ...
- Percentage of U.S. high school students
- ER Diagram Of Student Class School Course
- School and Training Plans | Floor Plans | Bar Graphs | High School ...
- Bar Graphs | School Nurse Office Sample Floor Plans
- Area Charts | Divided Bar Diagrams | Primary School Line Plan ...
- Bar Charts And Pie Charts On Food Security In India