 ATM UML Diagrams
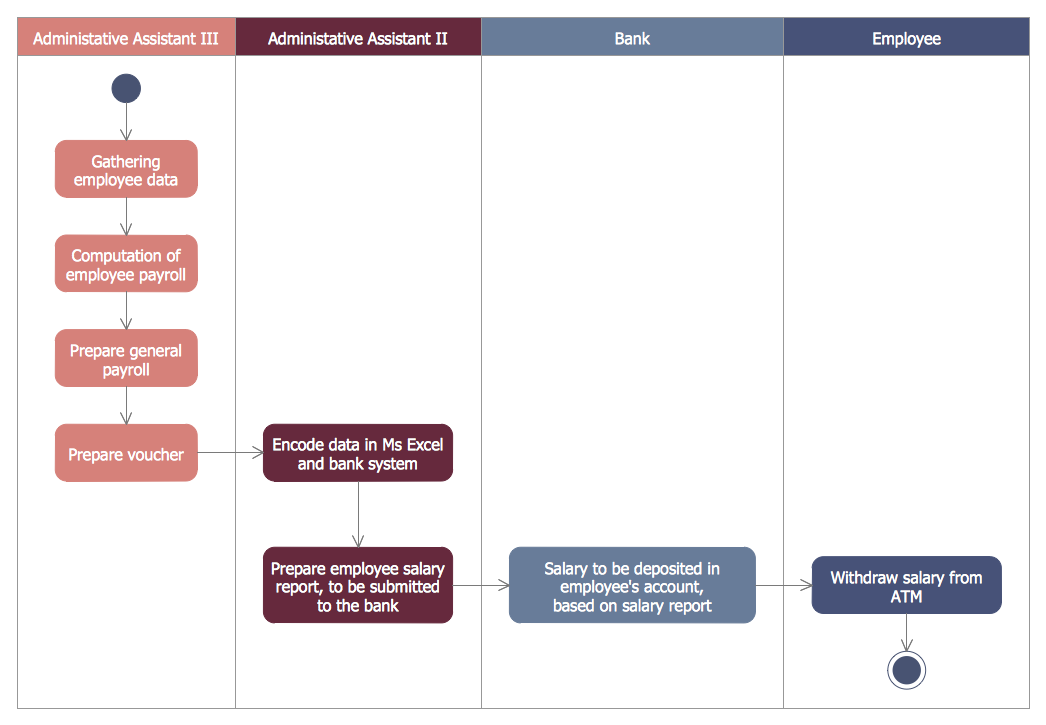
The ATM UML Diagrams solution lets you create ATM solutions and UML examples. Use ConceptDraw DIAGRAM as a UML diagram creator to visualize a banking system.
Bank UML Diagram
The vector stencils library "Logical symbols" contains 49 logical symbols for drawing logical network topology diagrams.
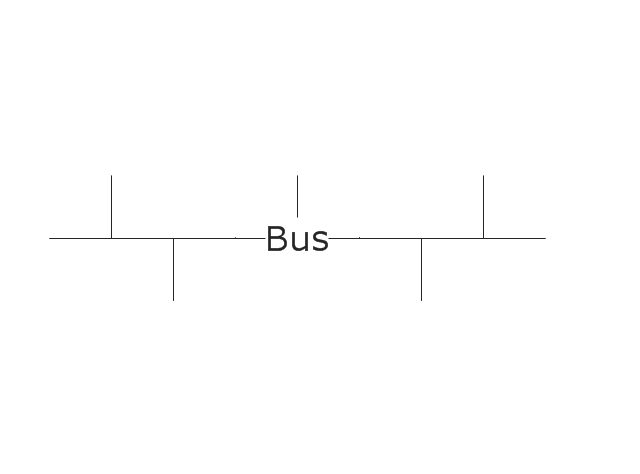
"Logical topology, or signal topology, is the arrangement of devices on a computer network and how they communicate with one another. How devices are connected to the network through the actual cables that transmit data, or the physical structure of the network, is called the physical topology. Physical topology defines how the systems are physically connected. It represents the physical layout of the devices on the network. The logical topology defines how the systems communicate across the physical topologies.
Logical topologies are bound to network protocols and describe how data is moved across the network. ... EXAMPLE : twisted pair Ethernet is a logical bus topology in a physical star topology layout. While IBM's token ring is a logical ring topology, it is physically set up in star topology." [Logical topology. Wikipedia]
The icons example "Logical symbols - Vector stencils library" was created using the ConceptDraw PRO diagramming and vector drawing software extended with the Computer and Networks solution from the Computer and Networks area of ConceptDraw Solution Park.
www.conceptdraw.com/ solution-park/ computer-and-networks
Coaxial Line Tag

Fiber Optic Line Tag
Twisted Pair Line Tag

SC2200 Signaling Controller

Bridge

Network Management Appliance

Access Server (Communications Server)
-logical-symbols---vector-stencils-library.png--diagram-flowchart-example.png)
Terminal Server

Web Browser

Security Management, Cisco
Lock and Key

Lock

Key

Relational Database
Host
CSU/DSU
WAN
University
Government building

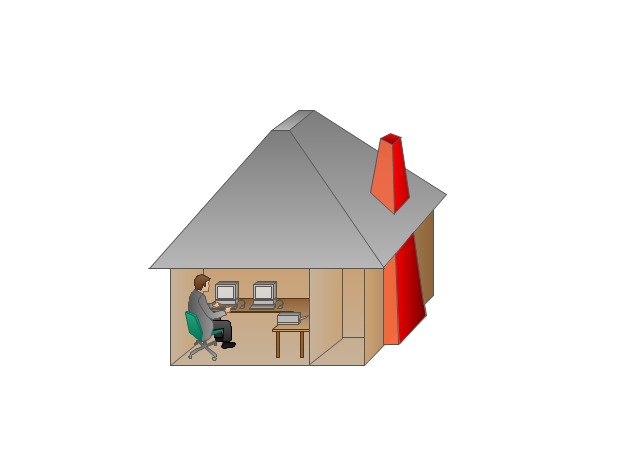
Home Office
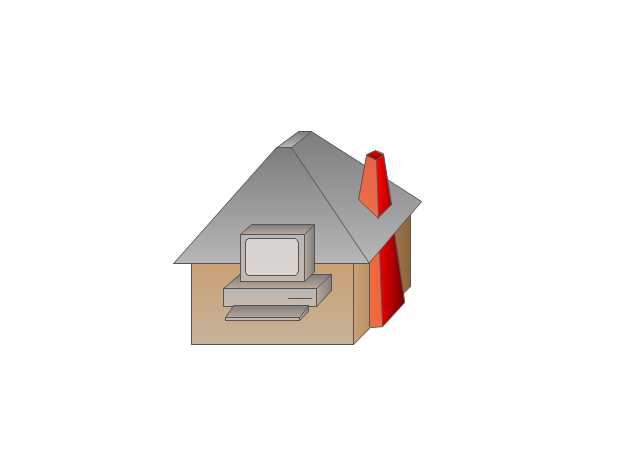
Telecommuter House PC
Medium Building, Regular
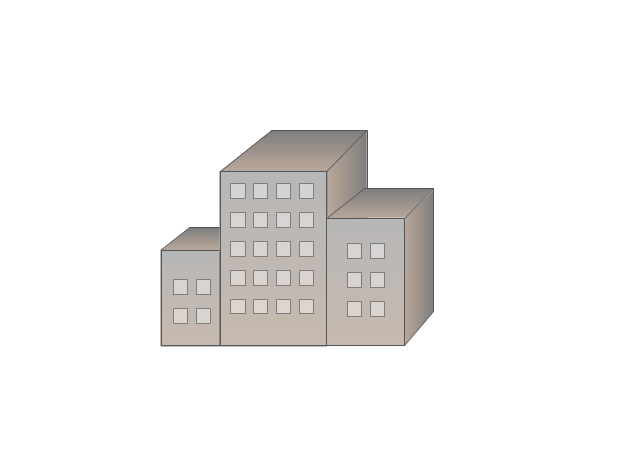
Headquarters, Subdued

House, Regular

Small Business

Network Connector

Dynamic Connector

Line Connector

Line-curve Connector

Bus
FDDI Ring
Peer-to-peer
Token-ring
Star

Comm-link

Curved Bus

Ethernet
Cloud

Speaker
Microphone

Router
ATM Router

ISDN Switch
ATM Switch
ATM/FastGB Etherswitch
Workgroup Switch
Small Hub
100BaseT Hub

CDDI-FDDI

ATM Solutions
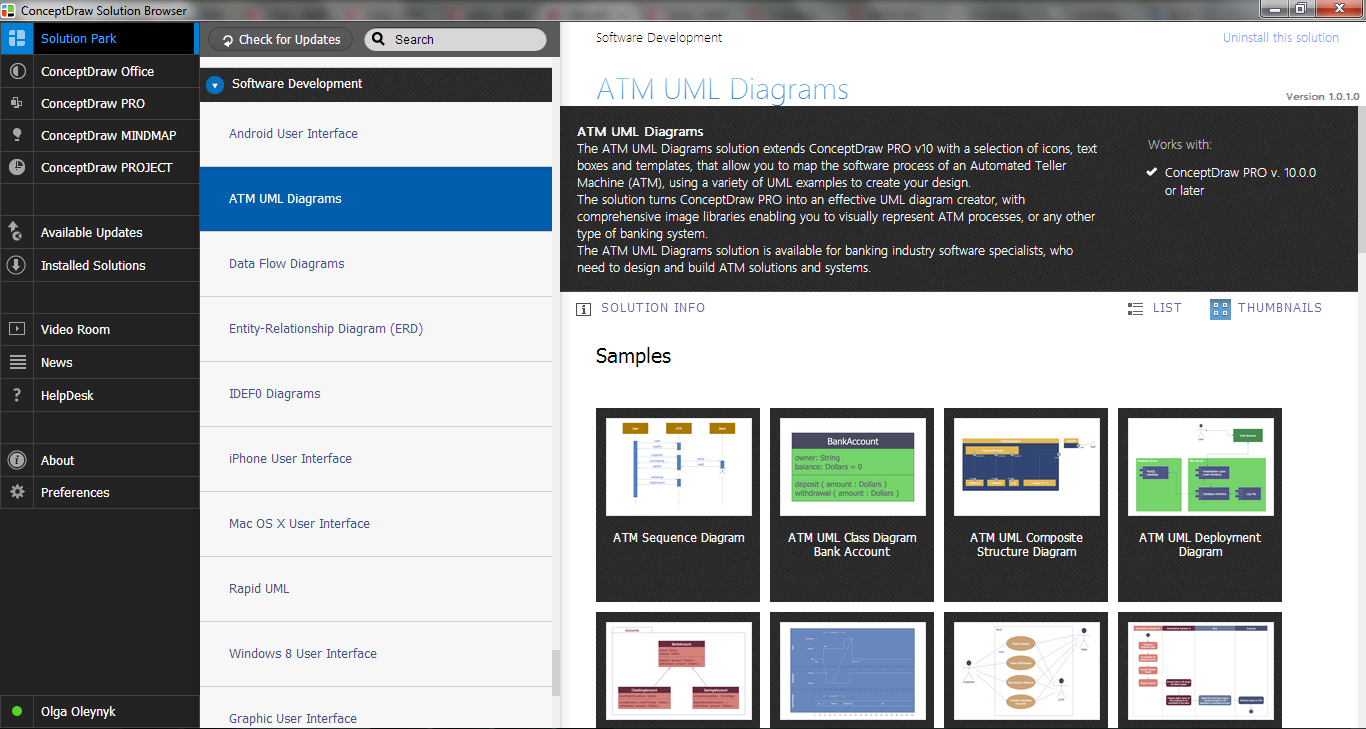
UML Use Case Diagram Example. Services UML Diagram. ATM system

UML Deployment Diagram Example - ATM System UML diagrams

Interaction Overview Diagram


Entity Relationship Diagram Software Engineering

Entity Relationship Diagram Examples


Diagramming Software for Design UML Activity Diagrams

- Entities Of Atm Management System Database Project
- Data Flow Diagrams (DFD) | Dfd For Atm Management System
- ATM UML Diagrams | Databases Access Objects Model with ...
- Relation For Atm Database Project
- Database Diagram For Atm
- ATM UML Diagrams | Databases Access Objects Model with ...
- Atm Management System Database Project
- Data Model For Atm System
- Entity-Relationship Diagram (ERD) | Er Diagram For Atm System
- ATM UML Diagrams | Data Flow Diagrams (DFD) | Use Case ...