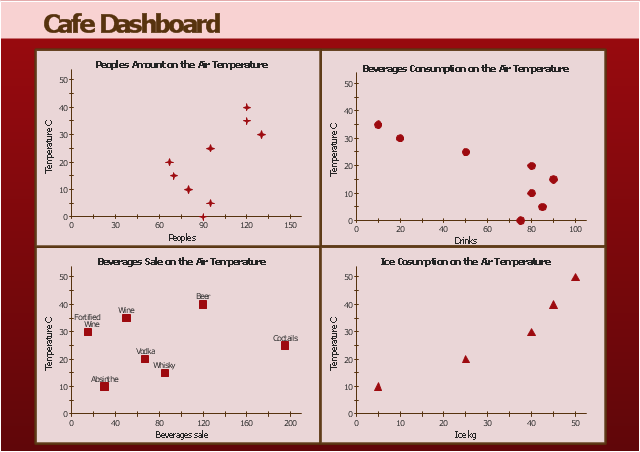
The scatter plots in this example of visual dashboard are used to visualize correlations between the air temperature and the cafe business metrics: visitors number, beverage consumption, beverage sale, ice consumption.
"In statistics, dependence is any statistical relationship between two random variables or two sets of data. Correlation refers to any of a broad class of statistical relationships involving dependence. ...
Correlations are useful because they can indicate a predictive relationship that can be exploited in practice. ...
Formally, dependence refers to any situation in which random variables do not satisfy a mathematical condition of probabilistic independence. In loose usage, correlation can refer to any departure of two or more random variables from independence, but technically it refers to any of several more specialized types of relationship between mean values." [Correlation and dependence. Wikipedia]
The example "Air temperature correlations - Cafe dashboard" was created using the ConceptDraw PRO diagramming and vector drawing software extended with the Corellation Dashboard solution from the area "What is a Dashboard" of ConceptDraw Solution Park.
Visual dashboard
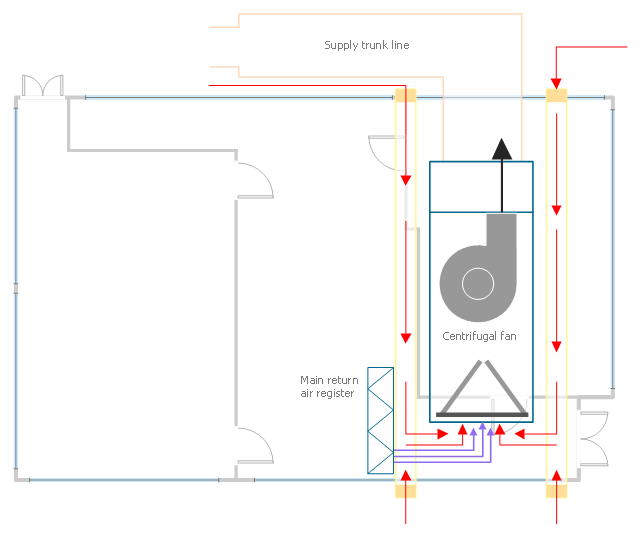
This HVAC plan sample shows the air handler layout on the floor plan.
"An air handler, or air handling unit (often abbreviated to AHU), is a device used to condition and circulate air as part of a heating, ventilating, and air-conditioning (HVAC) system. An air handler is usually a large metal box containing a blower, heating or cooling elements, filter racks or chambers, sound attenuators, and dampers. Air handlers usually connect to a ductwork ventilation system that distributes the conditioned air through the building and returns it to the AHU. Sometimes AHUs discharge (supply) and admit (return) air directly to and from the space served without ductwork.
Small air handlers, for local use, are called terminal units, and may only include an air filter, coil, and blower; these simple terminal units are called blower coils or fan coil units. A larger air handler that conditions 100% outside air, and no recirculated air, is known as a makeup air unit (MAU). An air handler designed for outdoor use, typically on roofs, is known as a packaged unit (PU) or rooftop unit (RTU)." [Air handler. Wikipedia]
The floor plan example "Air handler - HVAC plan" was created using the ConceptDraw DIAGRAM diagramming and vector drawing software extended with the HVAC Plans solution from the Building Plans area of ConceptDraw Solution Park.
Floor plan
This pie chart sample shows the atmosphere air composition. It was designed on the base of the Wikimedia Commons file: Air composition pie chart.JPG.
[commons.wikimedia.org/ wiki/ File:Air_ composition_ pie_ chart.JPG]
This file is licensed under the Creative Commons Attribution-Share Alike 3.0 Unported license. [creativecommons.org/ licenses/ by-sa/ 3.0/ deed.en]
"The atmosphere of Earth is a layer of gases surrounding the planet Earth that is retained by Earth's gravity. The atmosphere protects life on Earth by absorbing ultraviolet solar radiation, warming the surface through heat retention (greenhouse effect), and reducing temperature extremes between day and night (the diurnal temperature variation).
The common name given to the atmospheric gases used in breathing and photosynthesis is air. By volume, dry air contains 78.09% nitrogen, 20.95% oxygen, 0.93% argon, 0.039% carbon dioxide, and small amounts of other gases. Air also contains a variable amount of water vapor, on average around 1%. Although air content and atmospheric pressure vary at different layers, air suitable for the survival of terrestrial plants and terrestrial animals currently is only known to be found in Earth's troposphere and artificial atmospheres." [Atmosphere of Earth. Wikipedia]
The pie chart example "Atmosphere air composition" was created using the ConceptDraw PRO diagramming and vector drawing software extended with the Pie Charts solution of the Graphs and Charts area in ConceptDraw Solution Park.
Pie chart

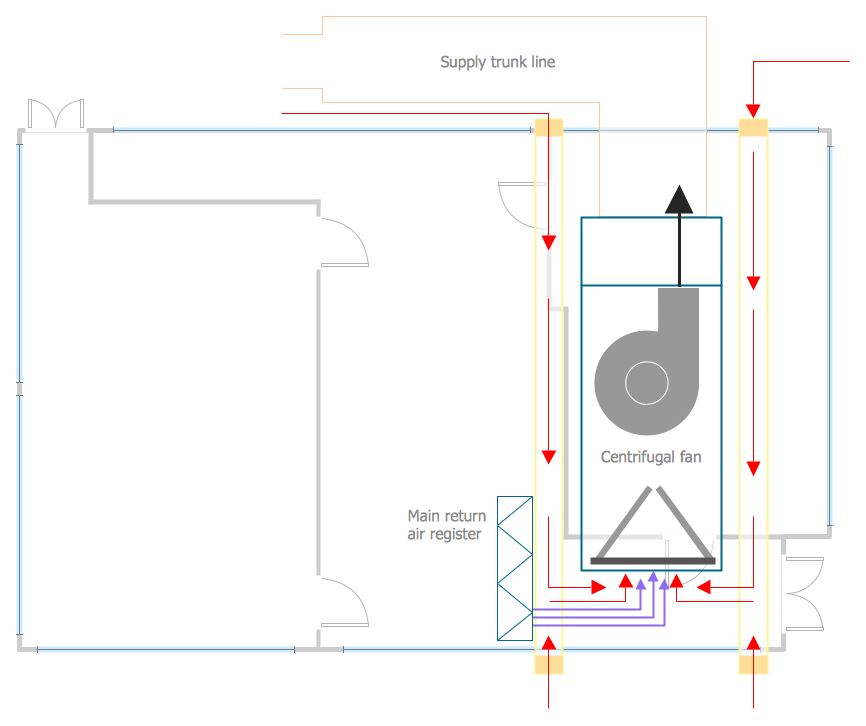
This HVAC floor plan sample shows the ventilation duct system layout.
"Ducts are used in heating, ventilation, and air conditioning (HVAC) to deliver and remove air. The needed airflows include, for example, supply air, return air, and exhaust air. Ducts commonly also deliver ventilation air as part of the supply air. As such, air ducts are one method of ensuring acceptable indoor air quality as well as thermal comfort.
A duct system is also called ductwork. Planning (laying out), sizing, optimizing, detailing, and finding the pressure losses through a duct system is called duct design." [Duct (flow). Wikipedia]
The HVAC floor plan example "Ductwork layout" was created using the ConceptDraw DIAGRAM diagramming and vector drawing software extended with the HVAC Plans solution from the Building Plans area of ConceptDraw Solution Park.
HVAC floor plan

 HVAC Plans
Use HVAC Plans solution to create professional, clear and vivid HVAC-systems design plans, which represent effectively your HVAC marketing plan ideas, develop plans for modern ventilation units, central air heaters, to display the refrigeration systems for automated buildings control, environmental control, and energy systems.
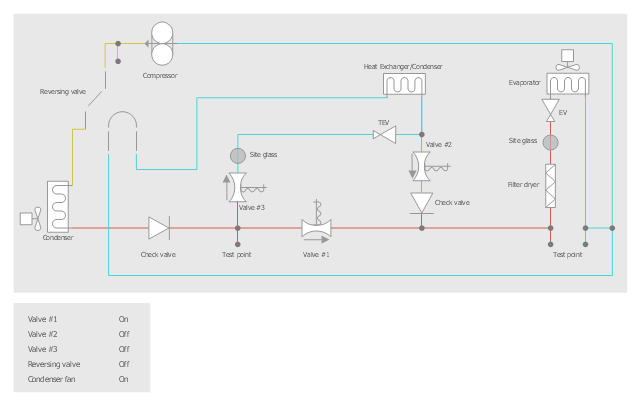
This HVAC schematics sample depicts the house cool mode of central air pool heater. It was drawn on the base of the HVAC schematics in the post "Central Air Pool Heater" from the Nathan Stratton's blog.
"With House Cool Mode, hot gas leaves the compressor runs through the reversing value into the condenser where it condenses into a liquid. Valve #1 is ON so liquid is able to leave the outside unit and run through the filter dryer and site glass into the evaporator upstairs in the house where the liquid flashes into a gas as it passes through the expansion valve and absorbs heat from the air passing through the evaporator. The cold gas travels downstairs and outside to the compressor and the cycle starts all over again." [robotics.net/ projects/ central-air-pool-heater/ ]
The HVAC schematics example "Central air pool heater" was created using the ConceptDraw DIAGRAM diagramming and vector drawing software extended with the HVAC Plans solution from the Building Plans area of ConceptDraw Solution Park.
HVAC schematics
HVAC Business Plan
Percentage Pie Chart. Pie Chart Examples

 Basic Pie Charts
This solution extends the capabilities of ConceptDraw DIAGRAM (or later) with templates, samples, and a library of vector stencils for drawing pie and donut charts.
Rainfall Bar Chart

- Example Of Air Transportation
- Atmosphere air composition | Percentage Pie Chart. Pie Chart ...
- Percentage Pie Chart. Pie Chart Examples | Atmosphere air ...
- Air Duct Sample Plan Layout
- Examples Of Air Registers In Air Transportation
- Atmosphere air composition | Water cycle diagram | Percentage Pie ...
- HVAC Plans | How to Create a HVAC Plan | Air handler- HVAC plan ...
- Draw The Example Of Air Transportation
- Percentage Pie Chart. Pie Chart Examples | Business Report Pie ...