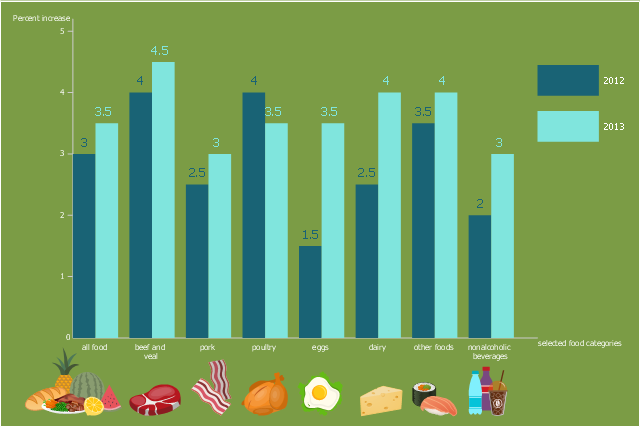
This double bar chart sample shows the forecasted impacts of 2012 drought expected to be larger in 2013 for most foods. It was designed in the base of the graph from the webpage "Price impacts of 2012 drought expected to be larger in 2013 for most foods" on the website of the United States Department of Agriculture Economic Research Service. [ers.usda.gov/ data-products/ chart-gallery/ detail.aspx?chartId=29456&ref=collection#.Ue5MMaxad5I]
"A price index (plural: “price indices” or “price indexes”) is a normalized average (typically a weighted average) of price relatives for a given class of goods or services in a given region, during a given interval of time. It is a statistic designed to help to compare how these price relatives, taken as a whole, differ between time periods or geographical locations.
Price indexes have several potential uses. For particularly broad indices, the index can be said to measure the economy's general price level or a cost of living. More narrow price indices can help producers with business plans and pricing. Sometimes, they can be useful in helping to guide investment." [Price index. Wikipedia]
The column chart example "Changes in price indices" was created using the ConceptDraw PRO diagramming and vector drawing software extended with the Bar Graphs solution from the Graphs and Charts area of ConceptDraw Solution Park.
Double bar graph
 Marketing Diagrams
Marketing Diagrams solution extends ConceptDraw DIAGRAM diagramming software with abundance of samples, templates and vector design elements intended for easy graphical visualization and drawing different types of Marketing diagrams and graphs, including Branding Strategies Diagram, Five Forces Model Diagram, Decision Tree Diagram, Puzzle Diagram, Step Diagram, Process Chart, Strategy Map, Funnel Diagram, Value Chain Diagram, Ladder of Customer Loyalty Diagram, Leaky Bucket Diagram, Promotional Mix Diagram, Service-Goods Continuum Diagram, Six Markets Model Diagram, Sources of Customer Satisfaction Diagram, etc. Analyze effectively the marketing activity of your company and apply the optimal marketing methods with ConceptDraw DIAGRAM software.
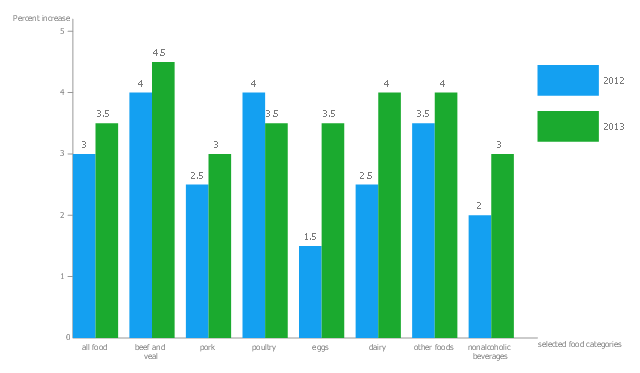
This two series column chart sample shows the forecasted changes in price indices for selected food categories in 2012 and 2013. It was designed on the base of the bar graph on the webpage "Price impacts of 2012 drought expected to be larger in 2013 for most foods" from the website of the United States Department of Agriculture Economic Research Service. [ers.usda.gov/ data-products/ chart-gallery/ detail.aspx?chartId=29456&ref=collection#.Ue5MMaxad5I]
"A price index (plural: “price indices” or “price indexes”) is a normalized average (typically a weighted average) of price relatives for a given class of goods or services in a given region, during a given interval of time. It is a statistic designed to help to compare how these price relatives, taken as a whole, differ between time periods or geographical locations.
Price indexes have several potential uses. For particularly broad indices, the index can be said to measure the economy's general price level or a cost of living. More narrow price indices can help producers with business plans and pricing. Sometimes, they can be useful in helping to guide investment." [Price index. Wikipedia]
The double bar chart example "Changes in price indices" was created using the ConceptDraw PRO diagramming and vector drawing software extended with the Basic Bar Graphs solution from the Graphs and Charts area of ConceptDraw Solution Park.
Double bar graph
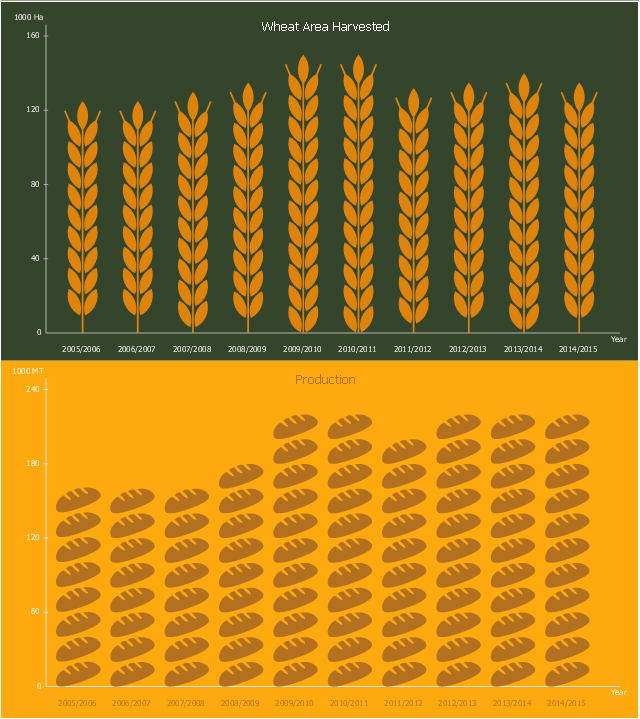
This picture bar graph sample shows wheat area harvested and production in Peru from 2006 to 2015. It was designed using data from website of the Foreign Agriculfural Service, the U.S. Department of Agriculture (USDA).
"Wheat remains a minor crop in Peru with most of the production concentrated in the temperate, southern highlands. Grown at 2,800 to 3,500 meters above sea level, production remains limited by geography as well as current economics. The Peruvian farmer cultivates only about two hectares of wheat, on average. While wheat production has increased slightly since 1994, it has remained relatively stable for the last six years at around 225,000 MT."
[fas.usda.gov/ data/ peru-wheat-production-limited-competition-corn-and-quinoa]
The pictorial chart example "Peru wheat area and production" was created using the ConceptDraw PRO diagramming and vector drawing software extended with the Picture Graphs solution from the Graphs and Charts area of ConceptDraw Solution Park.
Image chart
 Picture Graphs
Typically, a Picture Graph has very broad usage. They many times used successfully in marketing, management, and manufacturing. The Picture Graphs Solution extends the capabilities of ConceptDraw DIAGRAM with templates, samples, and a library of professionally developed vector stencils for designing Picture Graphs.
Lean Six Sigma Diagram Software

Material Requisition Flowchart. Flowchart Examples

 Floor Plans
Construction, repair and remodeling of the home, flat, office, or any other building or premise begins with the development of detailed building plan and floor plans. Correct and quick visualization of the building ideas is important for further construction of any building.
 Flowcharts
The Flowcharts solution for ConceptDraw DIAGRAM is a comprehensive set of examples and samples in several varied color themes for professionals that need to represent graphically a process. Solution value is added by the basic flow chart template and shapes' libraries of flowchart notation. ConceptDraw DIAGRAM flow chart creator lets one depict the processes of any complexity and length, as well as design the Flowchart either vertically or horizontally.
This line chart sample depicts data from the European Economic Forecast (EUROPEAN ECONOMY 1|2013, Economic and Financial Affairs Winter 2013, European Commission).
[ec.europa.eu/ economy_ finance/ publications/ european_ economy/ 2013/ pdf/ ee1_ en.pdf]
"Exports in France decreased to 36526 EUR Million in October of 2013 from 36637 EUR Million in September of 2013. Exports in France is reported by the Ministère de l'Économie et des Finances. Exports in France averaged 17102.29 EUR Million from 1970 until 2013, reaching an all time high of 37964 EUR Million in August of 2012 and a record low of 1165.60 EUR Million in May of 1970. France is one of the largest exporters of luxury goods and agricultural products in the world. France main exports are: aircrafts (10.1 percent of total exports), food (9.7 percent), chemicals (9.5 percent), industrial machinery (8.3 percent), iron and steel (7.9 percent), electronics (6.7 percent), motor vehicles (6.3 percent) and pharmaceuticals (6.1 percent). Trade outflows to Europe account for 70 percent of total exports. Main export partners are: Germany (16.6 percent of total exports), Italy (8.2 percent), Spain (7.3 percent), Belgium (7.2 percent), the United Kingdom (6.6 percent), the United States (5.6 percent), Netherlands and China. This page contains - France Exports - actual values, historical data, forecast, chart, statistics, economic calendar and news." [tradingeconomics.com/ france/ exports]
The line graph example "France exports of goods and services" was created using ConceptDraw PRO diagramming and vector drawing software extended with Line Graphs solution from Graphs and Charts area of ConceptDraw Solution Park.
Line chart

- Pictorial Charts Related To Agriculture
- Bar Graph On Agriculture
- Area Charts | Pie Charts Of Agriculture In India
- Bar Graphs Related To Agriculture Economics
- Pictorial Chart Related To Agriculture
- Time Series Graph In Years
- Time Series Dashboard | Chart Templates | Chart Examples | Bar ...
- Design elements - Time series charts | Chart Examples | Chart ...
- Changes in price indices - Double bar chart | Bar Chart Examples ...
- What Is a Picture Graph ? | Picture Graphs | Design elements ...