Activity on Node Network Diagramming Tool

Program Evaluation and Review Technique (PERT) with ConceptDraw DIAGRAM

Entity Relationship Diagram Examples

How to Discover Critical Path on a Gantt Chart

The PERT chart shows the logical connections and consequence of a set of tasks. PERT charts the time period for problem solving and the implementation plan for all activities along the critical path. The PERT chart is also known as a precedence diagram or project network diagram.
"The Program (or Project) Evaluation and Review Technique, commonly abbreviated PERT, is a statistical tool, used in project management, that is designed to analyze and represent the tasks involved in completing a given project. ...
PERT is a method to analyze the involved tasks in completing a given project, especially the time needed to complete each task, and to identify the minimum time needed to complete the total project.
PERT was developed primarily to simplify the planning and scheduling of large and complex projects. ...
A network diagram can be created by hand or by using diagram software. There are two types of network diagrams, activity on arrow (AOA) and activity on node (AON). Activity on node diagrams are generally easier to create and interpret." [Program Evaluation and Review Technique. Wikipedia]
The PERT chart is one of the Seven Management and Planning Tools (7 MP tools, Seven New Quality Tools).
The PERT chart template for the ConceptDraw PRO diagramming and vector drawing software is included in the solution "Seven Management and Planning Tools" from the Management area of ConceptDraw Solution Park.
PERT chart template

Legend

How To Use Collaboration Tool in Project Management

UML Activity Diagram

UML Activity Diagram. Design Elements


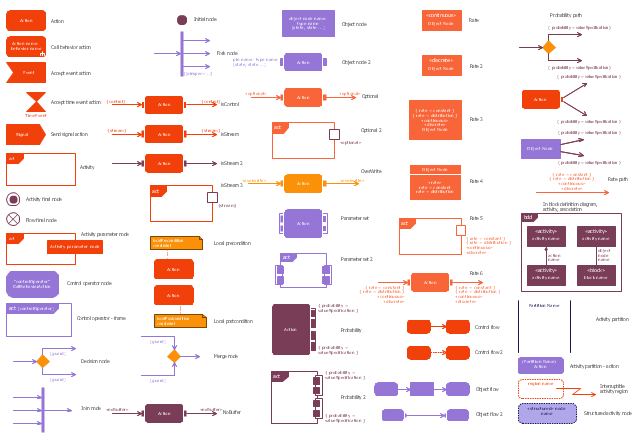
The vector stencils library "Activity diagram" contains 47 symbols.
Use it to design your SysML activity diagrams using ConceptDraw PRO diagramming and vector drawing software.
"Activity diagrams are constructed from a limited number of shapes, connected with arrows. The most important shape types:
- rounded rectangles represent actions;
- diamonds represent decisions;
- bars represent the start (split) or end (join) of concurrent activities;
- a black circle represents the start (initial state) of the workflow;
- an encircled black circle represents the end (final state).
Arrows run from the start towards the end and represent the order in which activities happen." [Activity diagram. Wikipedia]
The SysML shapes example "Design elements - Activity diagram" is included in the SysML solution from the Software Development area of ConceptDraw Solution Park.
SysML activity diagram symbols
"A project network is a graph (flow chart) depicting the sequence in which a project's terminal elements are to be completed by showing terminal elements and their dependencies.
... the project network shows the "before-after" relations.
The most popular form of project network is activity on node, the other one is activity on arrow.
The condition for a valid project network is that it doesn't contain any circular references." [Project network. Wikipedia]
The PERT chart example "Project management plan" was created using the ConceptDraw PRO diagramming and vector drawing software extended with the solution "Seven Management and Planning Tools" from the Management area of ConceptDraw Solution Park.
PERT

Legend

- PERT chart - Template | Activity On Arrow Diagram Generator
- Activity on Node Network Diagramming Tool | Network Analysis ...
- Activity Network (PERT) Chart | Activity Network Diagram Method ...
- Draw Activity On Arrow Diagram Online
- Diagramming Software for Design UML Activity Diagrams | UML ...
- Activity On Node Network Diagram
- Types of Flowcharts | Activity on Node Network Diagramming Tool ...
- Activities In A Project Management Software With Example Diagram
- Activity On Nodes
- Activity on Node Network Diagramming Tool | Activity Network ...