This site uses cookies. By continuing to browse the ConceptDraw site you are agreeing to our Use of Site Cookies.
HelpDesk

Accounting Information Systems Flowchart Symbols

Accounting Information system is a combination of software and hardware, as well as organizational support. Information system - it is not only the software and computers with network equipment, but also a list of instructions and standards which can be notated using Accounting information systems flowchart symbols. All information systems can be divided into information retrieval and data processing systems. Data Flow model is a hierarchical model. Each process can be divided into structural components, that depict by corresponding flowchart symbols, showing the accounting information system in communication with the external environment. The major components of accounting information systems flowchart are: entities, processes, data stores, and data flows. The set of standard accounting information flowchart symbols is intended to show the relationships between the system components. ConceptDraw DIAGRAM can help to draw clear accounting information system diagrams using special flowchart symbols.

UML Use Case Diagram Example. Services UML Diagram. ATM system

Services UML Diagram. ATM system. This sample was created in ConceptDraw DIAGRAM diagramming and vector drawing software using the UML Use Case Diagram library of the Rapid UML Solution from the Software Development area of ConceptDraw Solution Park. This sample shows the scheme of the servicing using the ATMs (Automated Teller Machines) and is used at the working of ATM banking systems, at the performing of the banking transactions.

UML Flowchart Symbols

The UML diagram is a powerful tool which lets visually represent all system's components, the interactions between them and relationships with external user interface. The Rapid UML solution for ConceptDraw DIAGRAM software offers diversity of UML flowchart symbols for drawing all types of UML diagrams.

Data Flow Diagram Process

Data Flow Diagram (DFD) is a hierarchy of functional processes, connected by data flows. The purpose of this presentation is to show how each process converts its inputs into outputs and to identify relationships between these processes. DFD is convenient way of modeling and construction the information processes, it step-by-step illustrates the flow of information in a process. For construction a DFD traditionally are used two different notations, which appropriate to the methods of Yourdon-Coad and Gane-Sarson. These notations slightly different from each other by graphical representation of symbols for processes, data stores, data flow, external entities. When designing a DFD it is required to decompose the system into the components (sub-systems), for explaining a complex system you may need represent numerous levels. The Data Flow Diagrams solution from ConceptDraw Solution Park contains numerous predesigned DFD symbols for both notations, which help easy and effectively design professional-looking Data Flow Diagrams (DFDs) and DFD Process Diagrams.

Account Flowchart. Flowchart Examples

Create your own flow charts of computer or network system account processing using the ConceptDraw DIAGRAM diagramming and vector drawing software extended with the Cross-Functional Flowcharts solution from the Business Processes area of ConceptDraw Solution Park. The flow chart example shows the computer network system account processing.

Financial Trade UML Use Case Diagram Example

This sample represents the actors, use cases and dependencies between them, and also the relationships between use cases. There are used dependency and use case generalization associations on this UML diagram. Use case generalization is used when you have two similar use cases, but one of them does more than another. This sample shows the work of the Financial Trade sphere and can be used by trading companies, commercial organizations, traders, different exchanges.

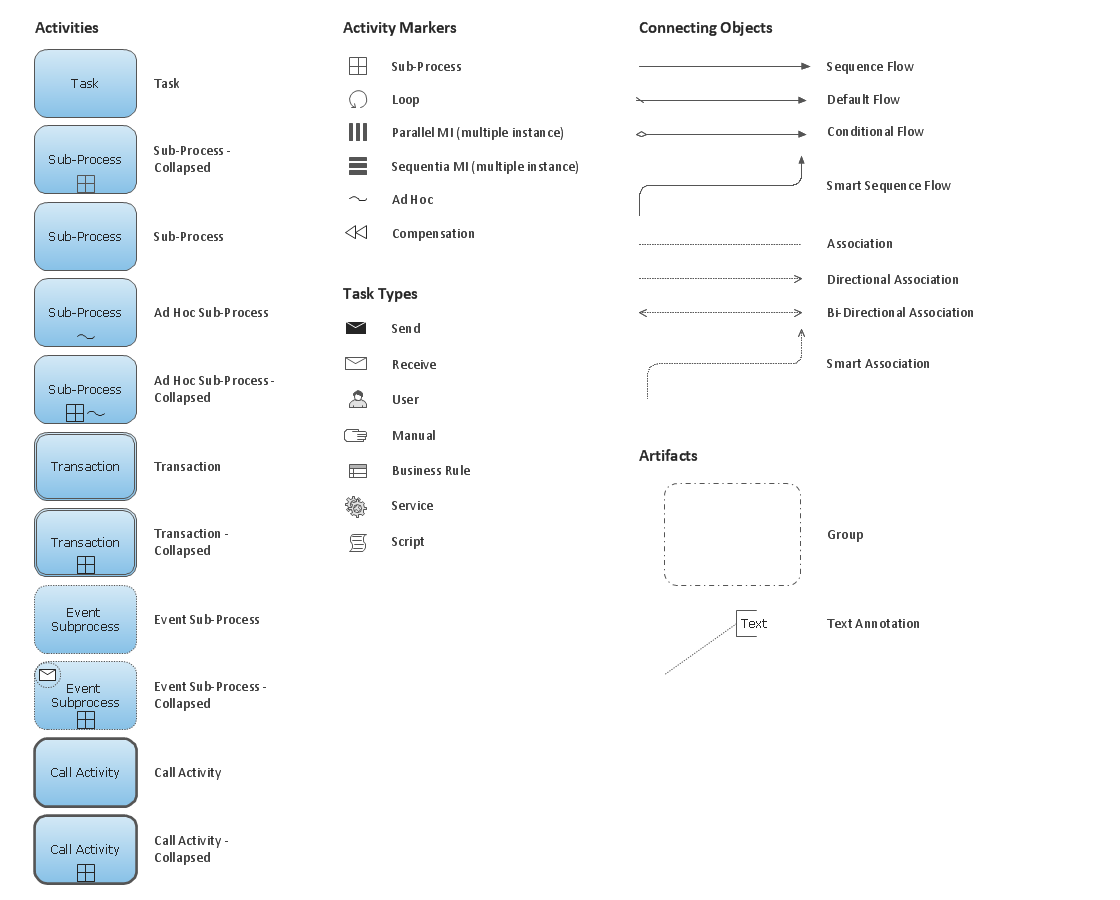
Business Process Elements: Activities

Create professional business process diagrams using ConceptDraw Activities library with 34 objects from BPMN.

UML Class Diagram Example - Apartment Plan

UML Apartment Plan. This sample was created in ConceptDraw DIAGRAM diagramming and vector drawing software using the UML Class Diagram library of the Rapid UML Solution from the Software Development area of ConceptDraw Solution Park. This sample show the detailed plan of the apartment and is used by building companies, design apartments, real estate agencies, at the buying / selling of the realty.

Credit Card Order Process Flowchart. Flowchart Examples

This sample was created in ConceptDraw DIAGRAM diagramming and vector drawing software using the Flowcharts solution from the Diagrams area of ConceptDraw Solution Park. This sample shows the Flowchart of the Credit Card Order Process. On this diagram are used the flowchart symbols that represents the processes and documents. The flowchart symbols are connected with arrows.
This example of UML class diagram models bank account system.
"A bank account is a financial account between a bank customer and a financial institution. A bank account can be a deposit account, a credit card, or any other type of account offered by a financial institution. The financial transactions which have occurred within a given period of time on a bank account are reported to the customer on a bank statement and the balance of the account at any point in time is the financial position of the customer with the institution. a fund that a customer has entrusted to a bank and from which the customer can make withdrawals." [Bank account. Wikipedia]
This bank account system UML class diagram example was created using the ConceptDraw PRO diagramming and vector drawing software extended with the ATM UML Diagrams solution from the Software Development area of ConceptDraw Solution Park.
UML class diagram of bank account system
UML class diagram of bank account system, uml 2.5 class, generalization, data type, association,