This vector stencils library contains 195 cloud computing icons.
Use it to design cloud computing infographic and diagrams with ConceptDraw PRO software.
"Cloud computing, also on-demand computing, is a kind of Internet-based computing that provides shared processing resources and data to computers and other devices on demand. It is a model for enabling ubiquitous, on-demand access to a shared pool of configurable computing resources (e.g., networks, servers, storage, applications and services), which can be rapidly provisioned and released with minimal management effort. Cloud computing and storage solutions provide users and enterprises with various capabilities to store and process their data in third-party data centers.
Cloud computing has become a highly demanded service or utility due to the advantages of high computing power, cheap cost of services, high performance, scalability, accessibility as well as availability." [Cloud computing. Wikipedia]
The vector stencils library "Cloud clipart" is included in the Cloud Computing Diagrams solution from the Computer and Networks area of ConceptDraw Solution Park.
Access point

Airport

Alert

Banknote

Banknote bundle

Banknote bundles

Backup

Bar chart

Big data

Book (closed)
-cloud-clipart---vector-stencils-library.png--diagram-flowchart-example.png)
Book (open)
-cloud-clipart---vector-stencils-library.png--diagram-flowchart-example.png)
Books

Box, close

Box, open

Braces

Brackets

Bug

Building

Bus

Cable connection

Calculator

Calendar

Car

CD/DVD

Check list

Check mark

Clock

Cloud

Cloud computing

Cloud database

Cloud hosting

Cloud storage

Code

Coffee cup

Coin

Coins stack

Coins stacks

Communication

Computer terminal

Console

CPU

Credit card

Cubes

Dashboard

Database

Databases

Datacenter

Dialog box

Dialog boxes

Document

Documents

Dollar sign

Download

Earth

Email

Equal sign

Ethernet jack

Ethernet plug

Euro sign

Exclamation mark

Eye

Feed symbol

Feedback

File

Files

Filter

Firewall

Flash drive

Folder

Folders

Gamepad

Gauge

Gear

Gears, 2

Gears, 3

Globe

Hacker

Hard drive

Heart

Heart rhythm

Home

Hosting

Hotel

House

Image

Info

IP phone

Jet

Key

Keyboard

Laptop

Lego

Letter

Light bulb

Lightning

Line chart

Linux penguin

List

Load balancer

Location mark

Lock, close

Lock, open

Lock and key

Log

Login

Logout

Magnifying glass

Mail

Map

Memory (RAM)
-cloud-clipart---vector-stencils-library.png--diagram-flowchart-example.png)
Microphone

Minus sign

Mobile phone

Monitor

Mouse

Movie

Music

Music player

Network

Network bus

Newspaper

NIC (Network interface controller)
-cloud-clipart---vector-stencils-library.png--diagram-flowchart-example.png)
Not found (Error 404)
-cloud-clipart---vector-stencils-library.png--diagram-flowchart-example.png)
Notebook

Office printer

Operator

Page

Pages

PC

Pencil

Photo

Photo camera

Pie chart

Platform

Plus sign

Pound sign

Printer

Puzzle

Puzzles, 2x2

Puzzles, 3x3

Question sign

Rackmount server

Router

Safe

Satellite

Satellite antenna

Schedule

Sensor

Server

Server rack

Shield

Ship

Shopping bag

Shopping basket

Shopping cart

Sign up

Smartphone

Social network

Software box

Sound

Spider

Spreadsheet

SSD

Star

Stars, 5

Stethoscope

Stickman

Stickmen

Suitcase

Support

Switch

Syringe

Tablet computer

Tools

Train

Truck

Truck 2

TV

Umbrella

Upload

User man

User woman

User profile

Video

Video camera

Video mail

Virtual disk

Virus

Wallet

Web camera

Wifi antenna

Wireless

Wrench

X cross symbol

Yen sign

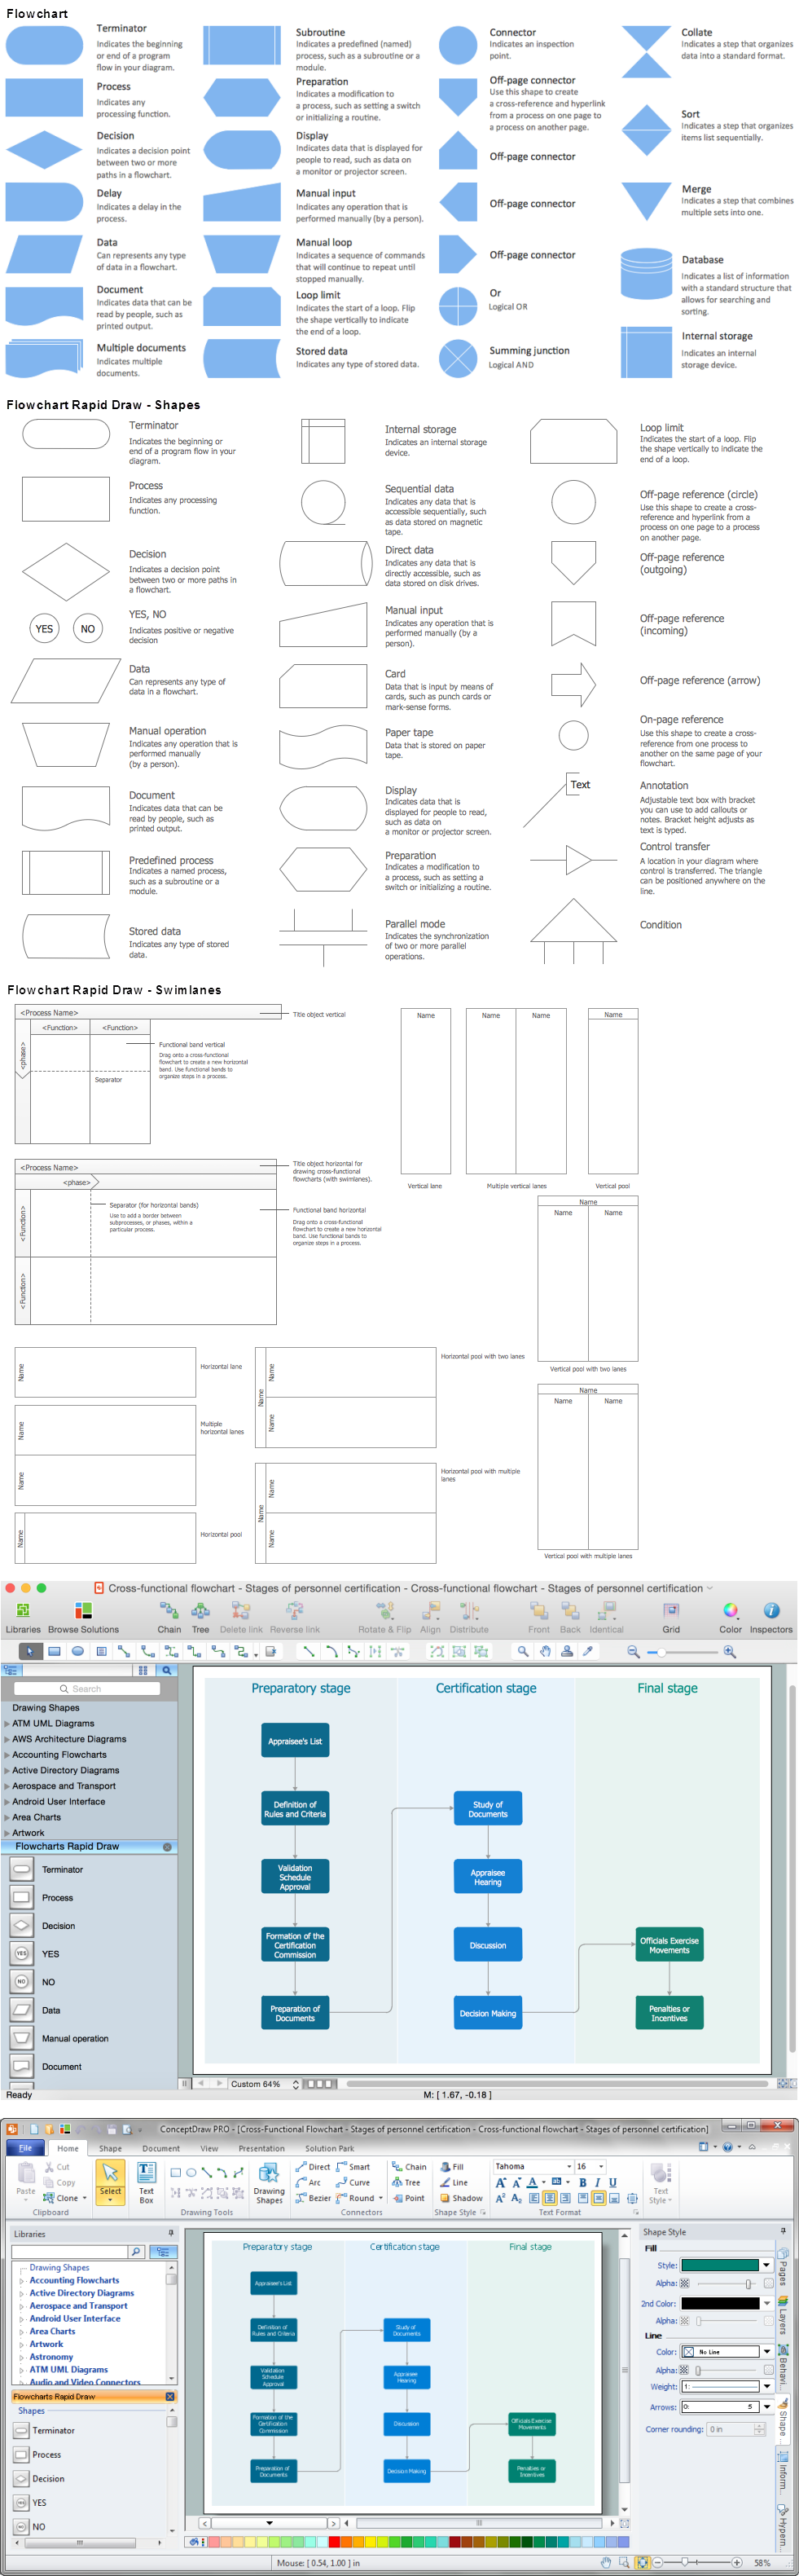
Technical Flow Chart Example

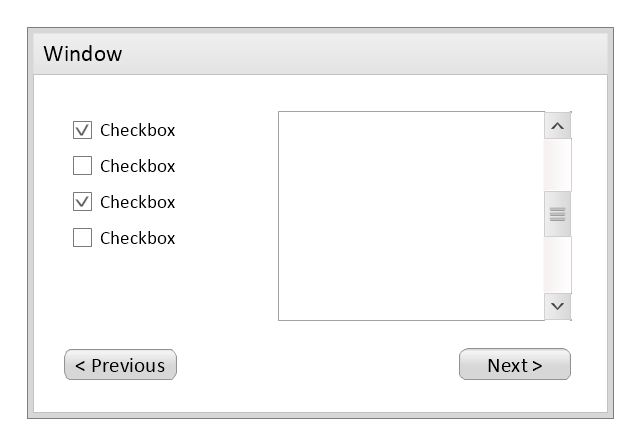
Use this template to prototype and design the wireframe graphic user interface (GUI).
"A website wireframe, also known as a page schematic or screen blueprint, is a visual guide that represents the skeletal framework of a website. Wireframes are created for the purpose of arranging elements to best accomplish a particular purpose. The purpose is usually being informed by a business objective and a creative idea. The wireframe depicts the page layout or arrangement of the website’s content, including interface elements and navigational systems, and how they work together. The wireframe usually lacks typographic style, color, or graphics, since the main focus lies in functionality, behavior, and priority of content. In other words, it focuses on what a screen does, not what it looks like. Wireframes can be pencil drawings or sketches on a whiteboard, or they can be produced by means of a broad array of free or commercial software applications. Wireframes are generally created by business analysts, user experience designers, developers, visual designers and other roles with expertise in interaction design, information architecture and user research.
Wireframes focus on:
(1) The kinds of information displayed.
(2) The range of functions available.
(3) The relative priorities of the information and functions.
(4) The rules for displaying certain kinds of information.
(5) The effect of different scenarios on the display.
The website wireframe connects the underlying conceptual structure, or information architecture, to the surface, or visual design of the website. Wireframes help establish functionality, and the relationships between different screen templates of a website. An iterative process, creating wireframes is an effective way to make rapid prototypes of pages, while measuring the practicality of a design concept. Wireframing typically begins between “high-level structural work - like flowcharts or site maps - and screen designs.” Within the process of building a website, wireframing is where thinking becomes tangible.
Aside from websites, wireframes are utilized for the prototyping of mobile sites, computer applications, or other screen-based products that involve human-computer interaction." [Website wireframe. Wikipedia]
The wireframe GUI template for the ConceptDraw PRO diagramming and vector drawing software is included in the Graphic User Interface solution from the Software Development area of ConceptDraw Solution Park.
Wireframe GUI template
ConceptDraw DIAGRAM ER Diagram Tool

Swim Lane Flowchart Symbols

Flowchart Programming Project. Flowchart Examples

This vector stencils library contains 195 cloud computing icons.
Use it to design cloud computing infographic and diagrams with ConceptDraw PRO software.
"Cloud computing, also on-demand computing, is a kind of Internet-based computing that provides shared processing resources and data to computers and other devices on demand. It is a model for enabling ubiquitous, on-demand access to a shared pool of configurable computing resources (e.g., networks, servers, storage, applications and services), which can be rapidly provisioned and released with minimal management effort. Cloud computing and storage solutions provide users and enterprises with various capabilities to store and process their data in third-party data centers.
Cloud computing has become a highly demanded service or utility due to the advantages of high computing power, cheap cost of services, high performance, scalability, accessibility as well as availability." [Cloud computing. Wikipedia]
The vector stencils library "Cloud clipart" is included in the Cloud Computing Diagrams solution from the Computer and Networks area of ConceptDraw Solution Park.
Use it to design cloud computing infographic and diagrams with ConceptDraw PRO software.
"Cloud computing, also on-demand computing, is a kind of Internet-based computing that provides shared processing resources and data to computers and other devices on demand. It is a model for enabling ubiquitous, on-demand access to a shared pool of configurable computing resources (e.g., networks, servers, storage, applications and services), which can be rapidly provisioned and released with minimal management effort. Cloud computing and storage solutions provide users and enterprises with various capabilities to store and process their data in third-party data centers.
Cloud computing has become a highly demanded service or utility due to the advantages of high computing power, cheap cost of services, high performance, scalability, accessibility as well as availability." [Cloud computing. Wikipedia]
The vector stencils library "Cloud clipart" is included in the Cloud Computing Diagrams solution from the Computer and Networks area of ConceptDraw Solution Park.
Access point
Airport
Alert
Banknote
Banknote bundle
Banknote bundles
Backup
Bar chart
Big data
Book (closed)
Book (open)
Books
Box, close
Box, open
Braces
Brackets
Bug
Building
Bus
Cable connection
Calculator
Calendar
Car
CD/DVD
Check list
Check mark
Clock
Cloud
Cloud computing
Cloud database
Cloud hosting
Cloud storage
Code
Coffee cup
Coin
Coins stack
Coins stacks
Communication
Computer terminal
Console
CPU
Credit card
Cubes
Dashboard
Database
Databases
Datacenter
Dialog box
Dialog boxes
Document
Documents
Dollar sign
Download
Earth
Email
Equal sign
Ethernet jack
Ethernet plug
Euro sign
Exclamation mark
Eye
Feed symbol
Feedback
File
Files
Filter
Firewall
Flash drive
Folder
Folders
Gamepad
Gauge
Gear
Gears, 2
Gears, 3
Globe
Hacker
Hard drive
Heart
Heart rhythm
Home
Hosting
Hotel
House
Image
Info
IP phone
Jet
Key
Keyboard
Laptop
Lego
Letter
Light bulb
Lightning
Line chart
Linux penguin
List
Load balancer
Location mark
Lock, close
Lock, open
Lock and key
Log
Login
Logout
Magnifying glass
Mail
Map
Memory (RAM)
Microphone
Minus sign
Mobile phone
Monitor
Mouse
Movie
Music
Music player
Network
Network bus
Newspaper
NIC (Network interface controller)
Not found (Error 404)
Notebook
Office printer
Operator
Page
Pages
PC
Pencil
Photo
Photo camera
Pie chart
Platform
Plus sign
Pound sign
Printer
Puzzle
Puzzles, 2x2
Puzzles, 3x3
Question sign
Rackmount server
Router
Safe
Satellite
Satellite antenna
Schedule
Sensor
Server
Server rack
Shield
Ship
Shopping bag
Shopping basket
Shopping cart
Sign up
Smartphone
Social network
Software box
Sound
Spider
Spreadsheet
SSD
Star
Stars, 5
Stethoscope
Stickman
Stickmen
Suitcase
Support
Switch
Syringe
Tablet computer
Tools
Train
Truck
Truck 2
TV
Umbrella
Upload
User man
User woman
User profile
Video
Video camera
Video mail
Virtual disk
Virus
Wallet
Web camera
Wifi antenna
Wireless
Wrench
X cross symbol
Yen sign
 Circular Arrows Diagrams
Circular Arrows Diagrams solution extends ConceptDraw DIAGRAM with extensive drawing tools, predesigned samples, Circular flow diagram template for quick start, and a library of ready circular arrow vector stencils for drawing Circular Arrow Diagrams, Segmented Cycle Diagrams, and Circular Flow Diagrams. The elements in this solution help managers, analysts, business advisers, marketing experts, scientists, lecturers, and other knowledge workers in their daily work.
Flow Diagram
- 5 Pencils
- Bubble diagrams in Landscape Design with ConceptDraw PRO | 5 ...
- Disaster Management Pencil Drawing
- Wireframe GUI - Template | Pencil Wireframe
- Top 5 Android Flow Chart Apps | Balance Diet Chart Sketch
- Pencil Sketch Diagram Of Balance Diet
- Balance Diet Chart Pencil Drawing
- Top 5 Android Flow Chart Apps | How to Design an Interface Mock ...
- Top 5 Android Flow Chart Apps | Technical Flow Chart | Tree ...