Made with
ConceptDraw
DIAGRAM 18

Organizational Structures

“An organizational structure defines how activities such as task allocation, coordination and supervision are directed towards the achievement of organizational aims. It can also be considered as the viewing glass or perspective through which individuals see their organization and its environment.

An organization can be structured in many different ways, depending on their objectives. The structure of an organization will determine the modes in which it operates and performs.”
[from Wikipedia]

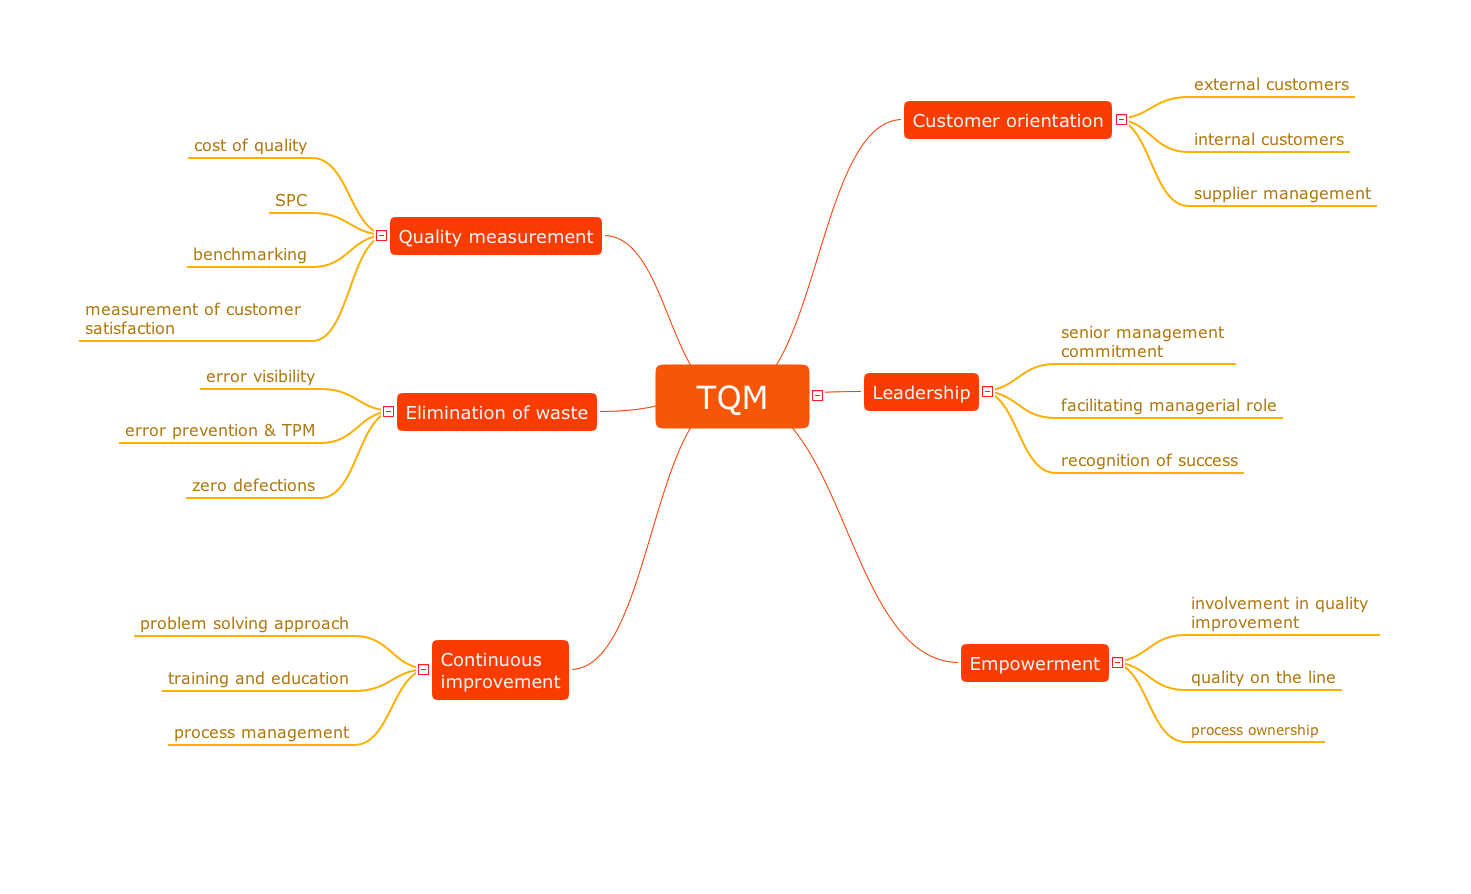
It is convenient to use a powerful software for developing and representing the organizational structures. ConceptDraw DIAGRAM diagramming and vector drawing software extended with Organizational Charts Solution from the Management Area is ideal for achievement this goal.

Organizational Structures *

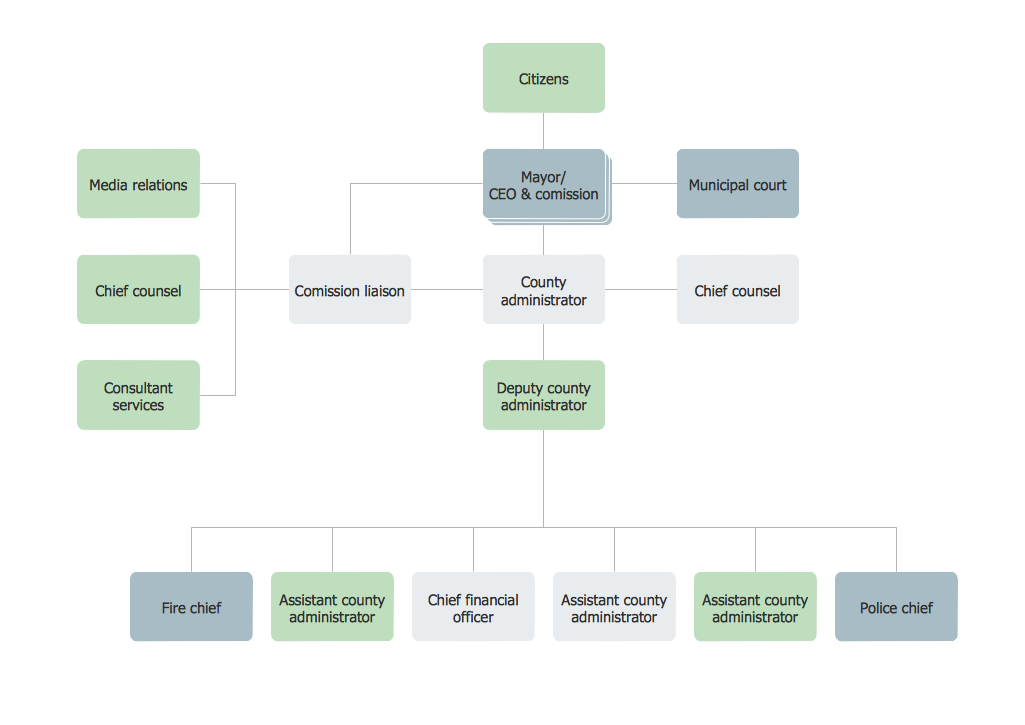
Example 1. Organizational Structures - County Administrator Office

Organizational Charts Solution offers the Organizational Chart library with variety of predesigned vector shapes and a set of samples, examples and templates for fast and easy drawing simple and complex organizational structures.

Organizational Charts Solution in ConceptDraw STORE

Example 2. Organizational Charts Solution in ConceptDraw STORE

All variety of templates and samples is available from ConceptDraw STORE. It's incredibly convenient tool which visually represents all previews and you can choose the desired from them in one moment.

Organizational Structures - United States Department of Labor

Example 3. Organizational Structures - United States Department of Labor

The organizational structures you see on this page were created in ConceptDraw DIAGRAM software using the Organizational Charts Solution for ConceptDraw DIAGRAM Solution Park. An experienced user spent 10-15 minutes creating each of these samples.

Use the Organizational Charts Solution for ConceptDraw DIAGRAM software to develop your own professional looking organizational structures quick, easy and effective.

All source documents are vector graphic documents. They are available for reviewing, modifying, or converting to a variety of formats (PDF file, MS PowerPoint, MS Visio, and many other graphic formats) from the ConceptDraw STORE. The Organizational Charts Solution is available for all ConceptDraw DIAGRAM or later users.


FIVE RELATED HOW TO's:
Gant Chart is a graphical representation of tasks as segments on a time scale. It helps plan and monitor project development or resource allocation. The horizontal axis is a time scale, expressed either in absolute or relative time.Gant Chart in Project Management *
Picture: Gant Chart in Project Management
Related Solution:
Now it’s easy to share your visual documents with other people in a form most convenient for them. ConceptDraw DIAGRAM can save your drawings and diagrams in a number of highly useful formats, including graphic files. You can save your drawing as a.PNG,.JPG, or other graphic format file.Export from ConceptDraw DIAGRAM Document to a Graphic File *
Picture: Export from ConceptDraw DIAGRAM Document to a Graphic File
Is it possible to draw a diagram as quickly as the ideas come to you? The innovative ConceptDraw Arrows10 Technology included in ConceptDraw DIAGRAM is a simple and powerful tool to create any type of diagram. You mau choose to start from one of plenty diagram templates or to use your own idea.How To Draw a Diagram *
Picture: How To Draw a Diagram
While creating flowcharts and process flow diagrams, you should use special objects to define different statements, so anyone aware of flowcharts can get your scheme right. There is a short and an extended list of basic flowchart symbols and their meaning. Basic flowchart symbols include terminator objects, rectangles for describing steps of a process, diamonds representing appearing conditions and questions and parallelograms to show incoming data. This diagram gives a general review of the standard symbols that are used when creating flowcharts and process flow diagrams. The practice of using a set of standard flowchart symbols was admitted in order to make flowcharts and other process flow diagrams created by any person properly understandable by other people. The flowchart symbols depict different kinds of actions and phases in a process. The sequence of the actions, and the relationships between them are shown by special lines and arrows. There are a large number of flowchart symbols. Which of them can be used in the particular diagram depends on its type. For instance, some symbols used in data flow diagrams usually are not used in the process flowcharts. Business process system use exactly these flowchart symbols.Flowchart example showing a customer request approval process with start, input output, process steps, decision branches, and end
Picture: Flowchart Symbols: Meaning and Examples
Related Solution:
The Organizational Chart is a diagram that shows the structure of the organization and the relationships of its parts. There are many ways to present the Organizational Chart. One of them is the Horizontal Organizational Chart: the parts of the diagram are arranged from left to right, or from right to left. This sample was created in ConceptDraw DIAGRAM diagramming and vector drawing software using the Organizational Charts Solution from the Management area of ConceptDraw Solution Park.Horizontal Orgchart *
Picture: Horizontal Orgchart
Related Solution:
ConceptDraw
DIAGRAM 18