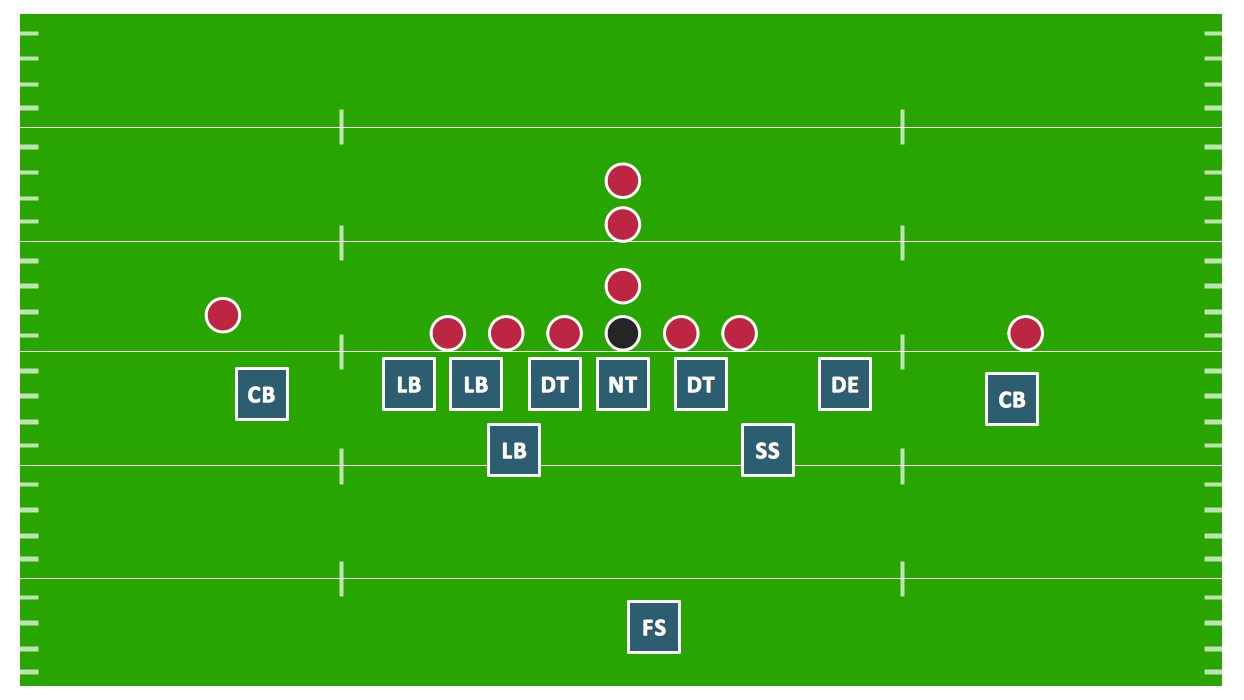
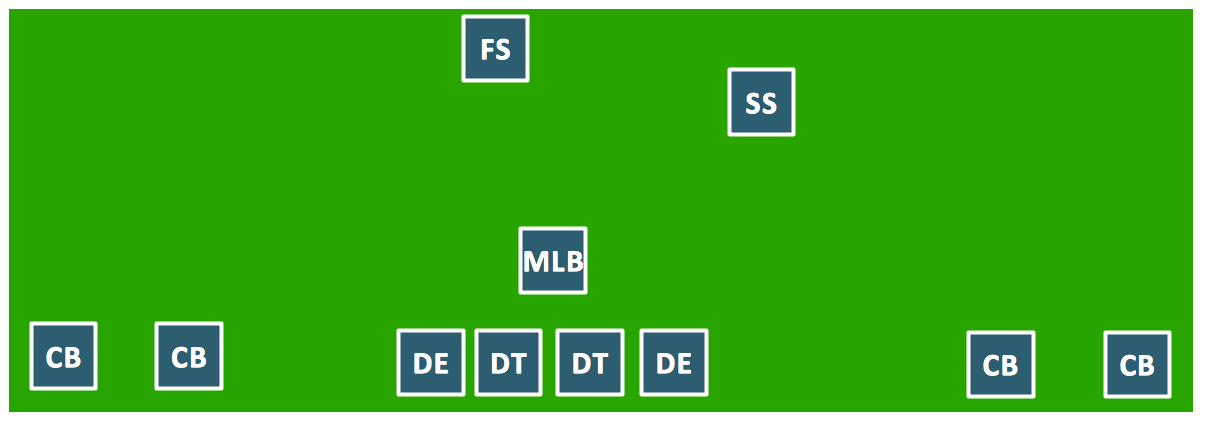
Dime Defense Diagram
"The dime defense is typically used against the most aggressive offensive passing formations. Whereas the nickel defense adds 1 more defender to the secondary (called a nickelback), the dime defense adds 2, bringing the grand total to 6. Just as two nickels equals one dime, two nickelbacks make a dime formation. Most often, what this all adds up to is 4 DLs, 1 LB, 4 CBs, and 2 safeties. But theoretically you there could be 3 DLs, 2 LBs, 3 CBs and 3 safeties. All that matters is that there are 6 in the secondary to defend against desperation passing plays."
Football diagram is the simplest way to explain American Football details. Plenty offenses and defenses may startle a newbie. Using visual method to explain the meaning of each formation, play or strategy gives a clear understanding. ConceptDraw DIAGRAM software extended with the Football solution is an amazing tool for producing and presenting football diagrams.
A combination of the "Football Fields" and "Football Positions" libraries gives you an ability to create a football-related drawing in seconds. Follow next steps to create you own football schema:
- From the "Football Fields" library drop a field object to your document
- From the "Football Positions" library drop all positions object you need to your document
- Place positions on the field according to your drawing idea
- Add arrows or text labels if needed.
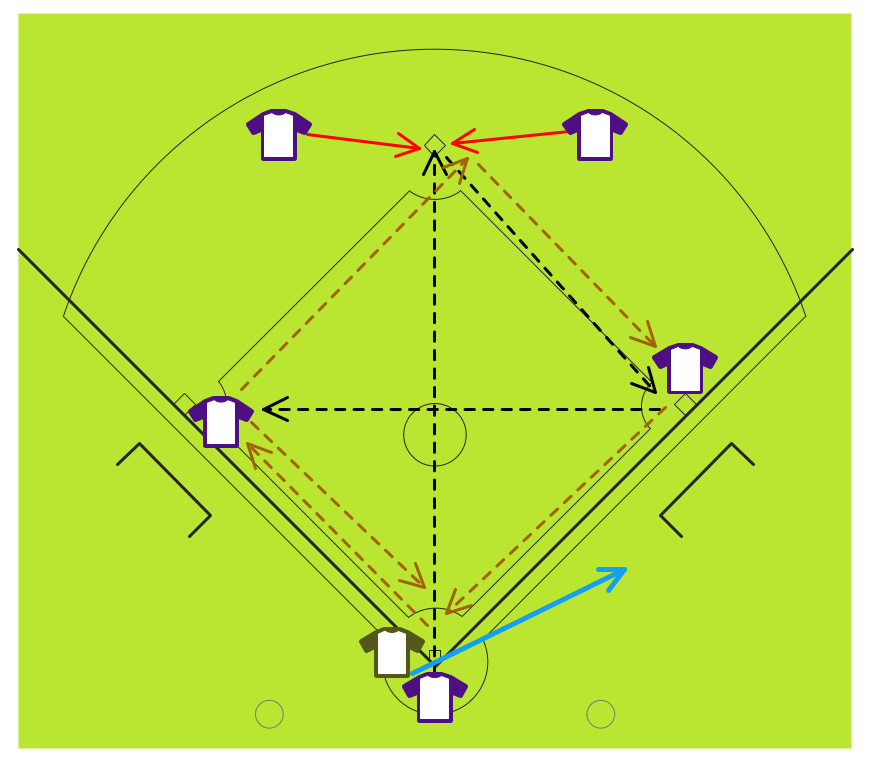
Using Layers feature you are able to add more depth to your drawing. Place the main drawing (as on sample below) onto the one layer, and then add text callouts, labels, frames, or arrows to explain how this defense works. Hide additional layers on start, and then make them visible one-by-one to make your explanation easier to perceive.
Sample 1. Football – Dime Defense.
This diagram was created in ConceptDraw DIAGRAM using the "Football Positions" library from the Football solution. An experienced user spent 30 minutes creating this sample.
The samples you see on this page were created in ConceptDraw DIAGRAM using the Football Solution; they demonstrate a portion of the solution's capabilities and the professional results you can achieve.
All source documents are vector graphic documents. They are available for reviewing, modifying, or converting to a variety of formats (PDF file, MS PowerPoint, MS Visio, and many other graphic formats) from the ConceptDraw STORE. The Football Solution is available for all ConceptDraw DIAGRAM or later users.