Made with
ConceptDraw
DIAGRAM 18

Business Models

“A business model describes the rationale of how an organization creates, delivers, and captures value, in economic, social, cultural or other contexts. The process of business model construction is part of business strategy.

In theory and practice, the term business model is used for a broad range of informal and formal descriptions to represent core aspects of a business, including purpose, business process, target customers, offerings, strategies, infrastructure, organizational structures, trading practices, and operational processes and policies.

Business models are used to describe and classify businesses, especially in an entrepreneurial setting, but they are also used by managers inside companies to explore possibilities for future development.”[from Wikipedia]

You need develop a business model? It’s very easy! All what you need is a powerful Business Process Diagram software. Never before creation of Business Models wasn’t so easy as now with Business Process Diagram Solution for ConceptDraw Solution Park.

Business Models *

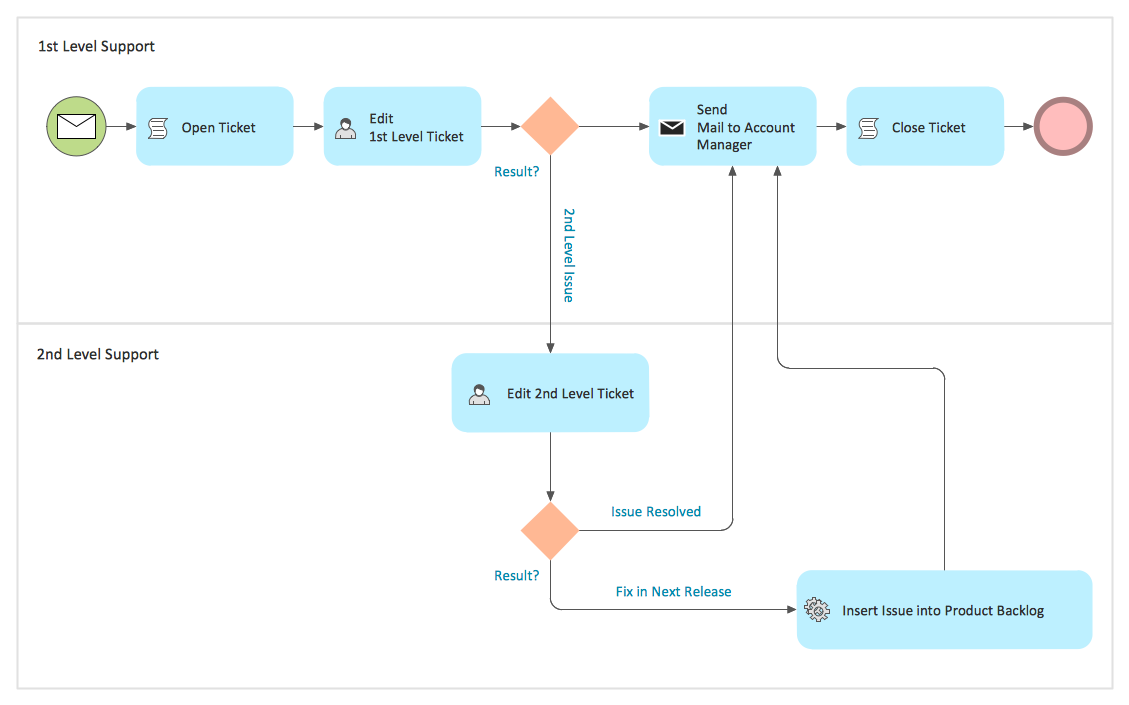
Example 1. Business Models - Trouble Ticket System

Business Process Diagram Solution offers 16 libraries of ready-to-use predesigned vector shapes to make your business models creation fast and easy:

  • Activities
  • Activities BPMN 1.2
  • Artifacts BPMN 1.2
  • Business Process - Rapid Draw
  • Choreographies
  • Connections BPMN 1.2
  • Conversations
  • Data
  • Events
  • Events BPMN 1.2
  • Expanded Objects
  • Expanded Objects BPMN 1.2
  • Gateways
  • Gateways BPMN 1.2
  • Swimlanes
  • Swimlanes BPMN 1.2

Business Models - Booking

Example 2. Business Models - Booking

Another way of representing the business models in ConceptDraw DIAGRAM is to use as the base the predesigned template or sample from ConceptDraw STORE. You can choose any desired sample or template from the offered which meets your requirements and change it for your needs, or simply use it as the source of inspiration.

Business Models - Logistics

Example 3. Business Models - Logistics

The samples you see on this page were created in ConceptDraw DIAGRAM using the tools of Business Process Diagram Solution from the Business Processes Area. They successfully demonstrate solution's capabilities and professional results you can achieve using it. An experienced user spent 10 minutes creating each of these samples.

Use the Business Process Diagram Solution for ConceptDraw DIAGRAM software to develop professional business models quick, easy and effective, and then successfully use them in your work activity.

All source documents are vector graphic documents. They are available for reviewing, modifying, or converting to a variety of formats (PDF file, MS PowerPoint, MS Visio, and many other graphic formats) from the ConceptDraw STORE. The Business Process Diagram Solution is available for all ConceptDraw DIAGRAM or later users.


NINE RELATED HOW TO's:
You need to draw the Circular Arrows Diagram, Segmented Diagram or Circular Flow Diagram? Any of these diagrams can be fast and easy designed in ConceptDraw DIAGRAM software, which offers the Business Diagrams Solution from the Management Area with extensive drawing tools, predesigned samples and circular flow diagram template. The use of ready template is the easiest way of drawing.Circular Flow Diagram Template *
Picture: Circular Flow Diagram Template
Related Solution:
This sample shows the UML Class Diagram that was created in ConceptDraw DIAGRAM on the Mac and then was opened for editing in MS Visio. Using the 13 libraries of the Rapid UML Solution for ConceptDraw DIAGRAM you can create your own visual vector UML diagrams quick and easy.UML Diagram Visio *
Picture: UML Diagram Visio
Related Solution:
Data flow diagrams are the graphical tool, used in the visualization of data flow of some data processing systems. It is the valuable process modeling tool. Also designing DFD is the important component of the initial part of any information system development project. The standard symbols are used to represent the interaction of a system components and how various kinds of components influence on data flow. The ConceptDraw Data Flow Diagrams solution is design to assist professional software engineers in making DFDs according to Gane and Sarson, and Yourdon and Coad notations. Do you imagine yourself as a successful IT specialist? To your mind, they all use data flow diagram examples to learn and to get inspired. Aren’t you still with us?Data Flow Diagram Examples *
Picture: Data Flow Diagram Examples
Related Solution:
Stakeholder analysis in conflict resolution, project management, and business administration, is the process of identifying the individuals or groups that are likely to affect or be affected by a proposed action, and sorting them according to their impact on the action and the impact the action will have on them. Use the ConceptDraw DIAGRAM diagramming and vector drawing software enhanced with powerful tools of Stakeholder Onion Diagrams Solution from the Management Area of ConceptDraw Solution Park to easy and effectively visualize stakeholder analysis.Visualize Stakeholder Analysis with Onion Diagram
Picture: Visualize Stakeholder Analysis with Onion Diagram
Related Solution:
Communication is the main challenge and the key success factor for remote project management. Communicating visually via Skype you bring all team and customers onto the one page. Remote Presentation for Skype solution for ConceptDraw MINDMAP helps communicate with remote team and customers in visual manner on wide range of issues. Using this solution for regular status meetings allows you to push your team on tasks and keep task statuses up to date.Communication Tool for Remote Project Management *
Picture: Communication Tool for Remote Project Management
Related Solution:
Developing a software project supposes architecture first. To make it proper, you can use data flow diagram model in your current project. The data flow diagram represents the Model of small traditional production enterprise that is made using Yourdon and Coad notation. It shows how the data is transfered through a process. According to the notation of Yourdon and Coad a process is represented by circles and data stores are drawn using parallel lines. This DFD was created using the ConceptDraw Data Flow Diagrams solution. Using this solution one can visualize data flow accordingly to the rules of two basic notations used for data flow modeling.Data Flow Diagram Model *
Picture: Data Flow Diagram Model
Related Solution:
ConceptDraw DIAGRAM extended with IDEF0 Diagrams solution from the Software Development area of ConceptDraw Solution Park is a powerful diagramming and vector drawing IDEF0 software. All IDEF0 diagrams created in ConceptDraw DIAGRAM are vector graphic documents and can be reviewed, modified and converted to MS Visio XML format. To obtain the IDEF0 Visio documents from ConceptDraw DIAGRAM documents use the wide export possibilities of ConceptDraw DIAGRAM.IDEF0 Visio *
Picture: IDEF0 Visio
Related Solution:
The Circular Arrows Diagrams are very popular in management and marketing. They are the useful way to visualize a sequence of steps, tasks, or events as a circular flow. But how design the Circular Arrows Diagram quick and easy? You will need a powerful software. ConceptDraw DIAGRAM charting and vector drawing software is exactly what you need. Extended with a multi-functional Business Diagrams solution from the Management Area, ConceptDraw DIAGRAM is the best for drawing the Circular Arrows Diagrams.Circular Arrows Diagram - Advanced Persistent Threat Lifecycle
Picture: Circular Arrows
Related Solution:
How to design a Bubble Chart? It’s very easy! All that you need is a powerful software. Never before creation of a Bubble Chart wasn’t so easy as now with tools of Business Diagrams Solution from the Management Area for ConceptDraw Solution Park.Bubble Chart - Page Rank *
Picture: Bubble Chart
Related Solution:
ConceptDraw
DIAGRAM 18