Using Fishbone Diagrams for Problem Solving
Problems are obstacles and challenges that one should overcome to reach the goal. They are an inseparable part of any business, and the success of an enterprise often depends on ability to solve all problems effectively. The process of problem solving often uses rational approach, helping to find a suitable solution. Using Fishbone Diagrams for Problem Solving is a productive and illustrative tool to identify the most important factors causing the trouble. ConceptDraw DIAGRAM extended with Fishbone Diagrams solution from the Management area of ConceptDraw Solution Park is a powerful tool for problem solving with Fishbone Ishikawa diagram graphic method.UML Sequence Diagram
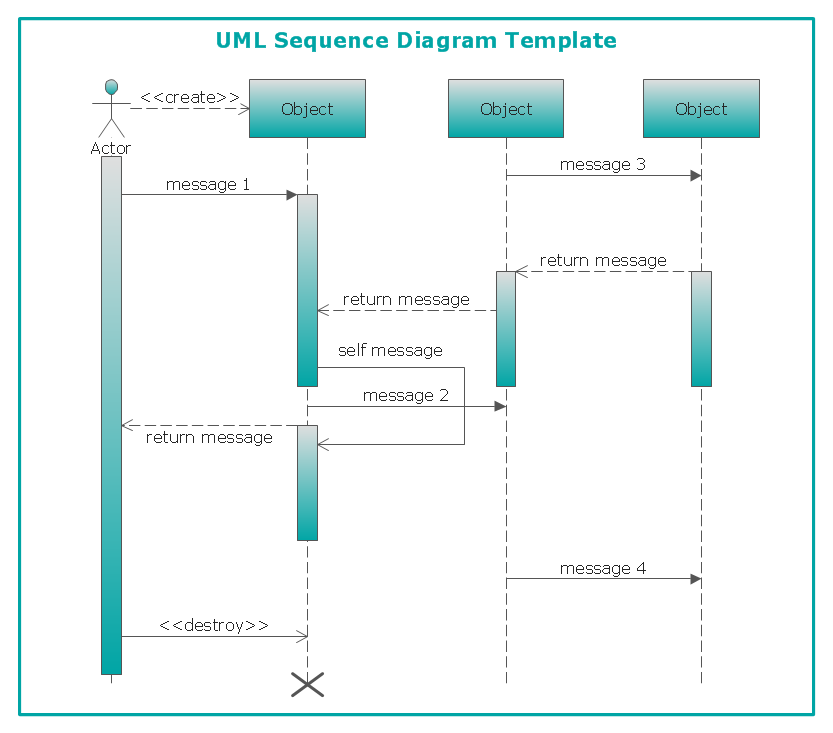
UML Sequence Diagram can be created using ConceptDraw DIAGRAM diagramming software contains rich examples and template. ConceptDraw is perfect for software designers and software developers who need to draw UML Sequence Diagrams.
UML Diagram
The accepted open standard that is used in software engineering and system design, when modeling object-oriented systems and business processes is known as Unified Modeling Language (UML). UML was created for definition, visualization, design and documentation software systems. It isn't a programming language, but on the base of UML model can be generated code. UML uses generic set of graphic notations for creation an abstract model of the system called UML-model. The UML notation lets visually represent requirements, subsystems, structural and behavioral patterns, logical and physical elements, etc. UML defines 13 types of diagrams: Class (Package), Use Case, Sequence, Object, Collaboration, Component, Timing, Interaction Overview, State Machine, Composite Structure, Activity, and Deployment. All these types of UML Diagrams can be fast and easy created with powerful ConceptDraw DIAGRAM software extended with special Rapid UML solution from Software Development area of ConceptDraw Solution Park.Sequence Diagram Tool
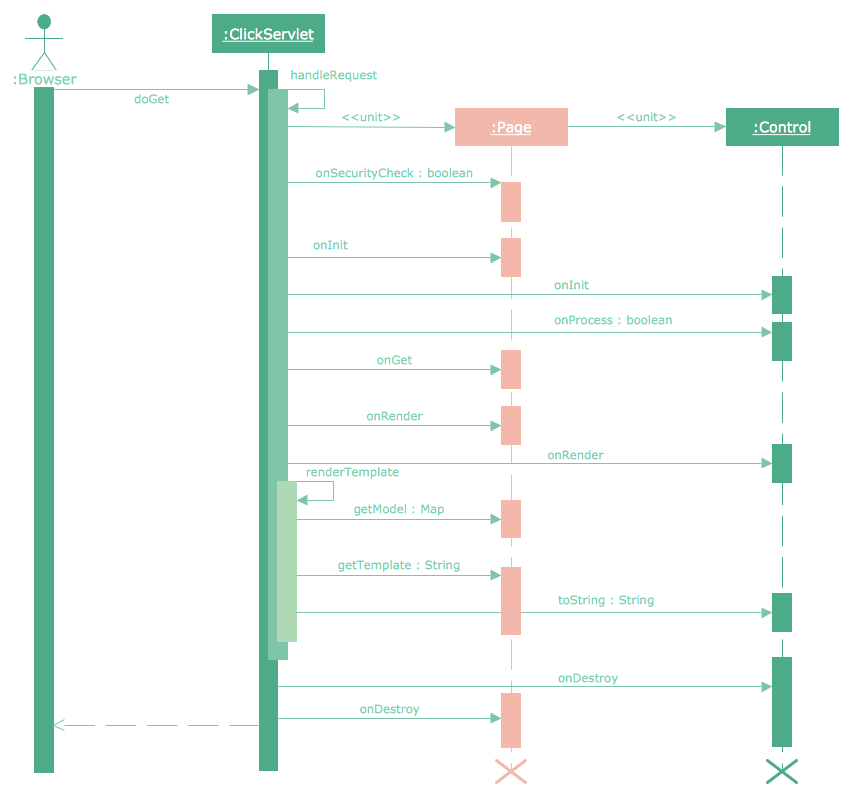
ConceptDraw DIAGRAM diagramming and vector drawing software as a sequence diagram tool provides the Rapid UML Solution from the Software Development Area that contains the UML Sequence library.Fishbone Diagram Problem Solving
The Ishikawa diagram, Cause and Effect diagram, Fishbone diagram — all they are the names of one and the same visual method for working with causal connections. Originally invented by Kaoru Ishikawa to control the process quality, the Ishikawa diagram is well proven in other fields of management and personal scheduling, events planning, time management. It is a chart in the form of a fish, whose head is a problem, the fins are variants for its causes. To design easily the Fishbone diagram, you can use a special ConceptDraw DIAGRAM ector graphic and diagramming software which contains the powerful tools for Fishbone diagram problem solving offered by Fishbone Diagrams solution for the Management area of ConceptDraw Solution Park.UML Process Diagram Example
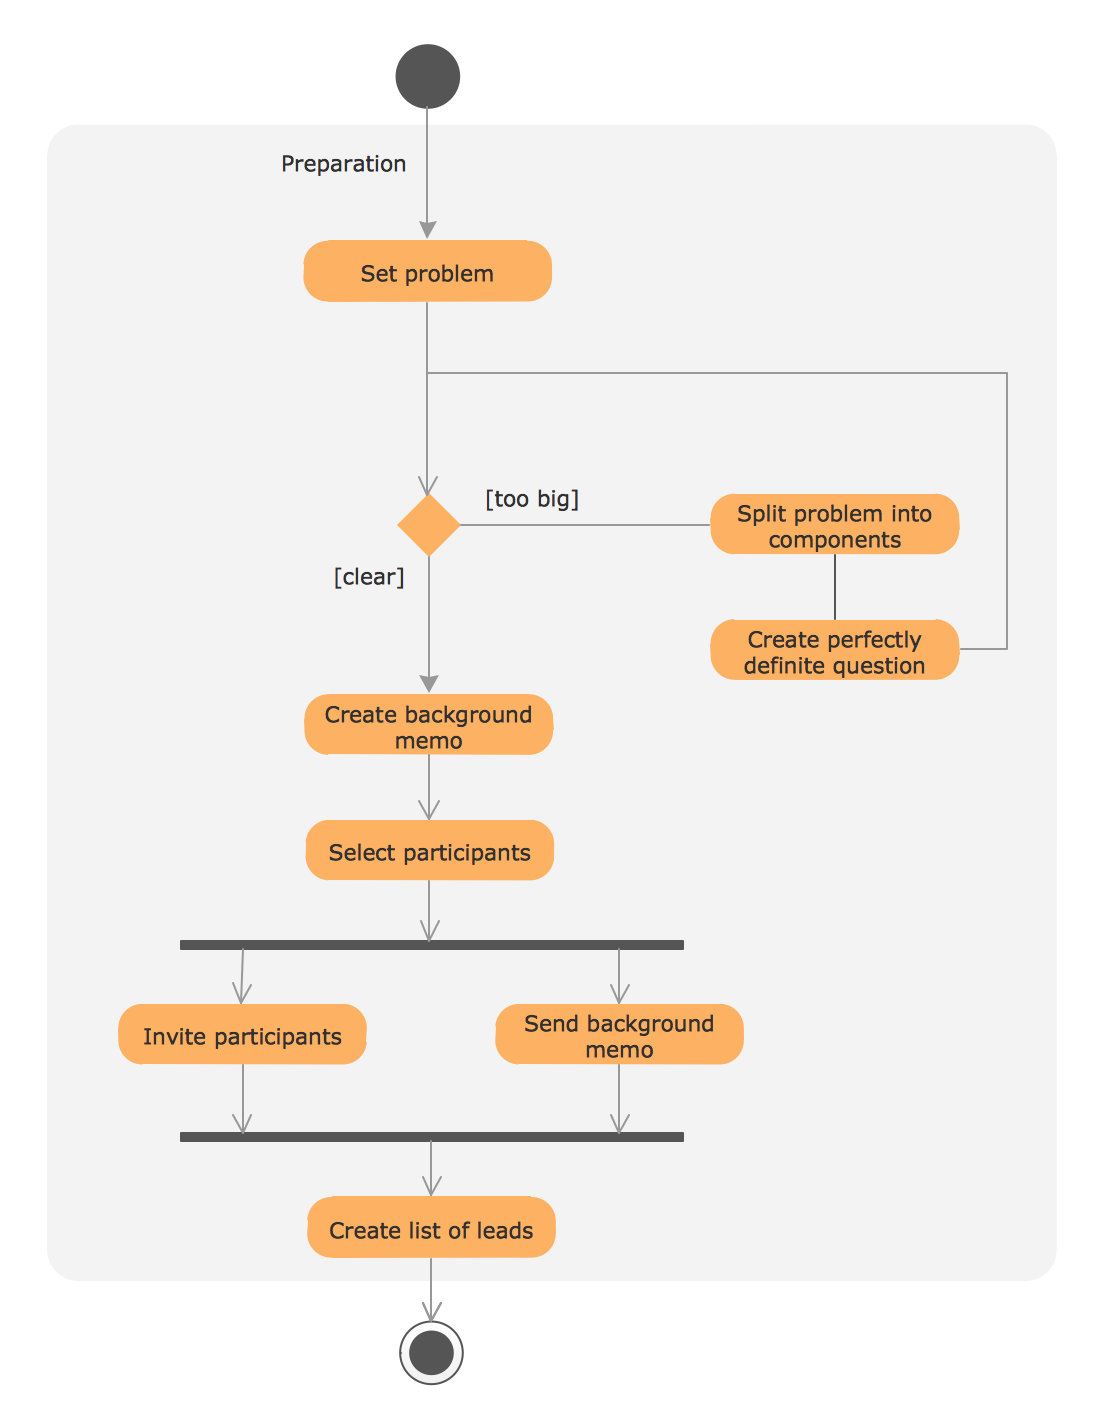
This sample shows the UML Activity Diagram that describes the flow of controls in the system. This is preparation to see how the system will work when executed. Black circle indicates the start of the workflow, encircled black circle indicates the end of the workflow. This sample shows the decision of the problem and can be used when you need to solve some set of problems.Program Evaluation and Review Technique (PERT) with ConceptDraw DIAGRAM
Program Evaluation and Review Technique (abbr. PERT) is a method developed by Ministry of Defense of the USA in 1958 for the project of creation the missile system Polaris. PERT diagram is one of the tools for project management that lets greatly simplify the planning and scheduling of large and complex projects. PERT diagram provides evaluation of project run-time and labor forces, it helps to analyze the time necessary for execution each of project tasks and the whole project, and to calculate the project critical path. PERT chart depicts the set of tasks connected each other in order of their execution and is constructed according to one of definite rules - AOA (activity on arrow) or AON (activity on node). It doesn't give you ready concrete decisions, but helps to find them. Design easy the PERT diagrams in ConceptDraw DIAGRAM software enhanced with Seven Management and Planning Tools solution from Management area of ConceptDraw Solution Park. You have a possibility to build the PERT chart of any type, but AON variant is easier for building and perception.Example of DFD for Online Store (Data Flow Diagram)
Data Flow Diagram (DFD) is a methodology of graphical structural analysis and information systems design, which describes the sources external in respect to the system, recipients of data, logical functions, data flows and data stores that are accessed. DFDs allow to identify relationships between various system's components and are effectively used in business analysis and information systems analysis. They are useful for system’s high-level details modeling, to show how the input data are transformed to output results via the sequence of functional transformations. For description of DFD diagrams are uses two notations — Yourdon and Gane-Sarson, which differ in syntax. Online Store DFD example illustrates the Data Flow Diagram for online store, the interactions between Customers, Visitors, Sellers, depicts User databases and the flows of Website Information. ConceptDraw DIAGRAM enhanced with Data Flow Diagrams solution lets you to draw clear and simple example of DFD for Online Store using special libraries of predesigned DFD symbols.
Fishbone Software Tools for Design Element
Cause and Effect diagram (Ishikawa diagram or Fishbone diagram) software helps you to show in one diagram the factors of Equipment, People, Process, Environment, Management and Materials, which all in general affect the overall problem and gives the base for the further analysis. ConceptDraw DIAGRAM is perfect software for designers and software developers who need to create Fishbone diagrams. You will get a simple problem-analysis tool - Fishbone software tools for design element to easy construct specific diagrams and identify many possible causes for an effect to attack complex problem solving.Design Elements for UML Diagrams
The Rapid UML solution from Software Development area of ConceptDraw Solution Park includes 13 vector stencils libraries for drawing the UML 2.4 diagrams using ConceptDraw DIAGRAM diagramming and vector drawing software.- Using Fishbone Diagrams for Problem Solving | Sequence Diagram ...
- Using Fishbone Diagrams for Problem Solving | PROBLEM ...
- Sequence Diagram For Solving Problem
- Event-driven Process Chain Diagrams | UML sequence diagram ...
- Cause and Effect Analysis
- Using Fishbone Diagrams for Problem Solving | Bar Diagrams for ...
- Symbols Of Problem Solving
- Process Flowchart | Technical Flow Chart Example | UML Tool ...
- Root cause analysis tree diagram - Personal problem solution | Root ...


_Win_Mac.png)
