This circle diagram sample was redesigned from the Wikimedia Commons file: Research cycle.png. "Some of the basic elements of the scientific method, arranged in a cycle to emphasize that it is an iterative process." [commons.wikimedia.org/ wiki/ File:Research_ cycle.png]
This file is licensed under the Creative Commons Attribution 2.0 Generic license. [creativecommons.org/ licenses/ by/ 2.0/ deed.en]
"The scientific method is a body of techniques for investigating phenomena, acquiring new knowledge, or correcting and integrating previous knowledge. To be termed scientific, a method of inquiry must be based on empirical and measurable evidence subject to specific principles of reasoning. ...
Four essential elements of the scientific method are iterations, recursions, interleavings, or orderings of the following:
(1) Characterizations (observations, definitions, and measurements of the subject of inquiry).
(2) Hypotheses (theoretical, hypothetical explanations of observations and measurements of the subject).
(3) Predictions (reasoning including logical deduction from the hypothesis or theory).
(4) Experiments (tests of all of the above)...
A linearized, pragmatic scheme of the four points above is sometimes offered as a guideline for proceeding:
(1) Define a question.
(2) Gather information and resources (observe).
(3) Form an explanatory hypothesis.
(4) Test the hypothesis by performing an experiment and collecting data in a reproducible manner.
(5) Analyze the data.
(6) Interpret the data and draw conclusions that serve as a starting point for new hypothesis.
(7) Publish results.
(8) Retest (frequently done by other scientists).
The iterative cycle inherent in this step-by-step method goes from point 3 to 6 back to 3 again." [Scientific method. Wikipedia]
The circle diagram example "Research cycle" was created using the ConceptDraw PRO diagramming and vector drawing software extended with the Target and Circular Diagrams solution from the Marketing area of ConceptDraw Solution Park.
www.conceptdraw.com/ solution-park/ marketing-target-and-circular-diagrams
Circle diagram

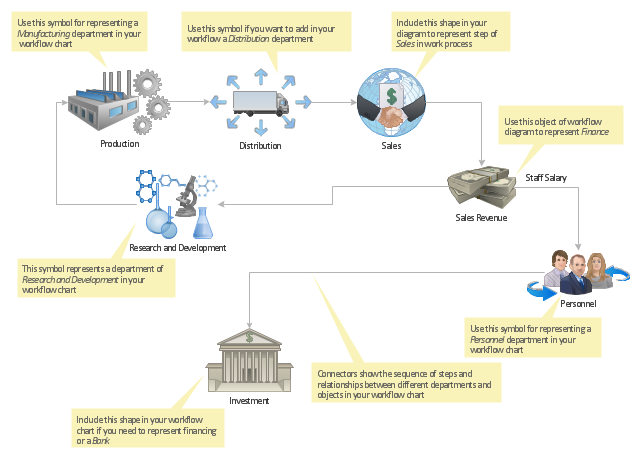
"Workflow components.
A workflow can usually be described using formal or informal flow diagramming techniques, showing directed flows between processing steps. Single processing steps or components of a workflow can basically be defined by three parameters:
(1) input description: the information, material and energy required to complete the step,
(2) transformation rules, algorithms, which may be carried out by associated human roles or machines, or a combination,
(3) output description: the information, material and energy produced by the step and provided as input to downstream steps.
Components can only be plugged together if the output of one previous (set of) component(s) is equal to the mandatory input requirements of the following component. Thus, the essential description of a component actually comprises only in- and output that are described fully in terms of data types and their meaning (semantics). The algorithms' or rules' description need only be included when there are several alternative ways to transform one type of input into one type of output – possibly with different accuracy, speed, etc.
When the components are non-local services that are invoked remotely via a computer network, such as Web services, additional descriptors (such as QoS and availability) also must be considered." [Workflow. Wikipedia]
The workflow diagram template for the ConceptDraw PRO diagramming and vector drawing software is included in the Workflow Diagrams solution from the Business Processes area of ConceptDraw Solution Park.
Workflow diagram template
 Stakeholder Onion Diagrams
The Stakeholder Onion Diagram is often used as a way to view the relationships of stakeholders to a project goal. A basic Onion Diagram contains a rich information. It shows significance of stakeholders that will have has influence to the success achieve
Basic Flowchart Symbols and Meaning


 Seven Management and Planning Tools
Seven Management and Planning Tools solution extends ConceptDraw PRO and ConceptDraw MINDMAP with features, templates, samples and libraries of vector stencils for drawing management mind maps and diagrams.
 IDEF Business Process Diagrams
Use the IDEF Business Process Diagrams solution to create effective database designs and object-oriented designs, following the integration definition methodology.
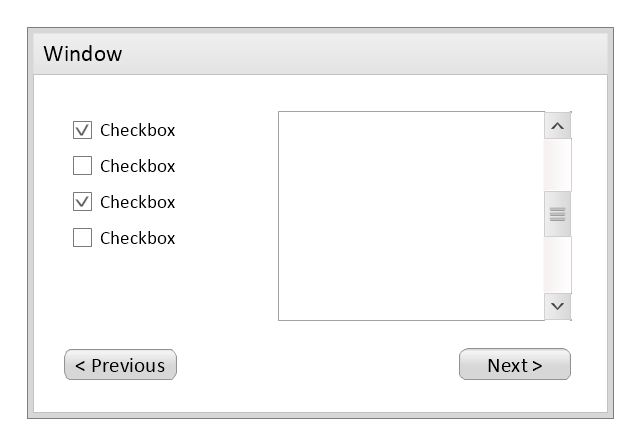
Use this template to prototype and design the wireframe graphic user interface (GUI).
"A website wireframe, also known as a page schematic or screen blueprint, is a visual guide that represents the skeletal framework of a website. Wireframes are created for the purpose of arranging elements to best accomplish a particular purpose. The purpose is usually being informed by a business objective and a creative idea. The wireframe depicts the page layout or arrangement of the website’s content, including interface elements and navigational systems, and how they work together. The wireframe usually lacks typographic style, color, or graphics, since the main focus lies in functionality, behavior, and priority of content. In other words, it focuses on what a screen does, not what it looks like. Wireframes can be pencil drawings or sketches on a whiteboard, or they can be produced by means of a broad array of free or commercial software applications. Wireframes are generally created by business analysts, user experience designers, developers, visual designers and other roles with expertise in interaction design, information architecture and user research.
Wireframes focus on:
(1) The kinds of information displayed.
(2) The range of functions available.
(3) The relative priorities of the information and functions.
(4) The rules for displaying certain kinds of information.
(5) The effect of different scenarios on the display.
The website wireframe connects the underlying conceptual structure, or information architecture, to the surface, or visual design of the website. Wireframes help establish functionality, and the relationships between different screen templates of a website. An iterative process, creating wireframes is an effective way to make rapid prototypes of pages, while measuring the practicality of a design concept. Wireframing typically begins between “high-level structural work - like flowcharts or site maps - and screen designs.” Within the process of building a website, wireframing is where thinking becomes tangible.
Aside from websites, wireframes are utilized for the prototyping of mobile sites, computer applications, or other screen-based products that involve human-computer interaction." [Website wireframe. Wikipedia]
The wireframe GUI template for the ConceptDraw PRO diagramming and vector drawing software is included in the Graphic User Interface solution from the Software Development area of ConceptDraw Solution Park.
Wireframe GUI template
 Target and Circular Diagrams
This solution extends ConceptDraw PRO software with samples, templates and library of design elements for drawing the Target and Circular Diagrams.
How To Use Enterprise Collaboration Software


How To Do A Mind Map In PowerPoint

- Target and Circular Diagrams | Research cycle - Circle diagram ...
- Research cycle - Circle diagram | Innovation life cycle - Arrow loop ...
- Is Research Process Circular
- Research cycle - Circle diagram | Research onion diagram ...
- Research cycle - Circle diagram | The Conclusion Drawn After ...
- Sales Research Template For Bank
- Circle Diagrams | Research cycle - Circle diagram | Circle-Spoke ...
- Research cycle - Circle diagram | Export from ConceptDraw PRO ...
- Research cycle - Circle diagram | Circle Diagrams | Circle-Spoke ...
- Process Flowchart | Research cycle - Circle diagram | Basic ...
- Circle Diagrams | Research cycle - Circle diagram | Lifecycle of an ...
- Research cycle - Circle diagram | Best Program to Make Workflow ...
- Research cycle - Circle diagram | 2 Circle Venn Diagram. Venn ...
- Research cycle - Circle diagram | Business feedback loop | Life ...
- Research cycle - Circle diagram | Biology Symbols | Product life ...
- Research cycle - Circle diagram | 3 Circle Venn Diagram. Venn ...
- Marketing infographics - Market research | Research cycle - Circle ...
- Research cycle - Circle diagram | How To Create Onion Diagram ...
- Research cycle - Circle diagram | DroidDia PRO unlocker | Porter ...
- Research cycle - Circle diagram | Circular diagrams - Vector stencils ...