Funnel Diagram
Funnel diagram can be also known as a funnel chart being similar to a stacked percent bar chart. This drawing is a type of chart that can be often used in order to represent the stages in some sales process. It can be also used for showing the amount of potential revenue for each of the described stages.
In order to make a funnel diagram, the Funnel Diagrams solution can be used while working in the ConceptDraw DIAGRAM diagramming and drawing software. Having the pre-made design elements as well as the examples of funnel diagrams, the Funnel Diagrams solution allows any ConceptDraw DIAGRAM user to make their own unique as well as professionally-looking drawings.
“Funnel callouts” stencil library from the Funnel Diagrams solution has such design elements as arrow-ended tail callout, callout with circle ends dotted tail, callout with circle ends tail, circle-ended tail callout, line callout with circle-ended start with text above, line callout with circle-ended start with text below, triangle-ended line callout with text above, triangle-ended line callout with text below, dotted line callout with arrowed start, rectangular callout with circle ends tail, roundrect callout with circle-ended tail, line callout with text above, line callout with text below, dotted line callout with text above, dotted line callout with text below, line callout with arrowed start, left brace callout, right brace callout, rounded callout with left arrow and roundrect callout with right arrow.
“Vertical funnels” stencil library offers the professionally pre-made design elements of vertical funnels, such as 1-stage vertical funnel, 2-stage vertical funnel, 3-stage vertical funnel, 4-stage vertical funnel, 5-stage vertical funnel, 6-stage vertical funnel, 7-stage vertical funnel, 8-stage vertical funnel, 9-stage vertical funnel, 1-stage 3D vertical funnel, 2-stage 3D vertical funnel, 3-stage 3D vertical funnel, 4-stage 3D vertical funnel, 5-stage 3D vertical funnel, 6-stage 3D vertical funnel, 7-stage 3D vertical funnel, 8-stage 3D vertical funnel and 9-stage vertical funnel.
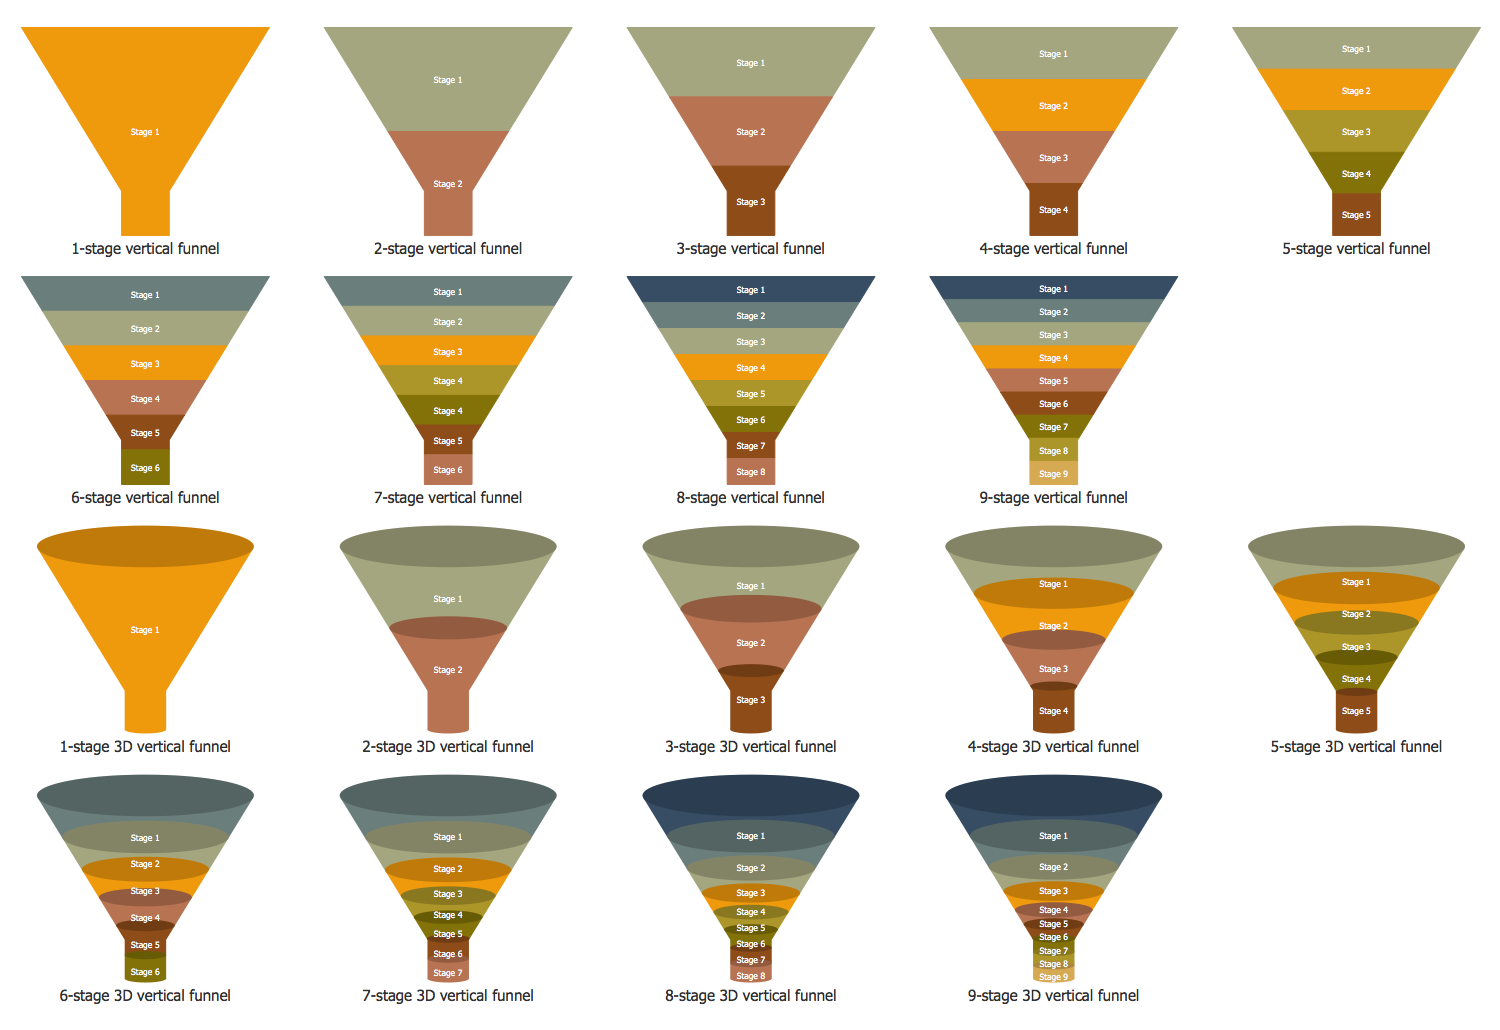
Vertical Funnels stencil library
The pre-made examples of the funnel diagrams include the “ACCA DAGMAR Model” which demonstrates the funnel diagram that includes 4 steps ACCA of DAGMAR. DAGMAR is an abbreviation for the Defining Advertising Goals for Measured Advertising Results marketing model. It was suggested in 1961 by Russel H. Colley being used since then. The mentioned abbreviation is composed of the first letters of the model components: A — Awareness, C — Comprehension, C — Conviction, and A — Action. Each of the steps of this process is represented as a separated layer on this funnel diagram. The ACCA advertising formula is known to be originating from the AIDA advertising formula. Nevertheless, it is known to be more popular and more comprehensive. Intended for measuring the advertising effectiveness as well as mapping the states of mind that the consumers may pass on the way to purchase. One of the most important parts of any DAGMAR model is the process of defining the target audience. Such a target audience is simply a group of people which the advertising message should be addressed to. It is also important to correctly formulate the objective of any advertising message.

Funnel Diagram — ACCA DAGMAR Model
“AIDA Purchase Funnel” example shows 4 steps of AIDA marketing model, these are A — Attention, I — Interest, D — Desire, and A — Action. It is a well-known as well as a widely-used model in a field of advertising and marketing. The AIDA marketing model allows depicting all the stages as well as the steps that take place from the moment when the consumer first faces with some brand or product through to the moment when the consumer decides to buy this product after testing it.

Funnel Diagram — AIDA Purchase Funnel
The mentioned model assists in comprehension efficiency as well as the influence of marketing and advertising communications on the making purchases by them as well as on the consumers. The AIDA model allows making the products of some specific brands which are well-recognizable for consumers. It also allows engaging the new consumers to buy the products of exactly this particular brand. For example, it can be done in order to advance the consumers using advertising and the marketing via the series of sequential steps from the first acquaintance with a brand to the purchase and consumption.
Funnel Diagram — AISDALSLove Hierarchy of Effects Model
AISDALSLove Hierarchy of Effects Model example of the funnel diagram demonstrates the AISDALSLove hierarchy of the effects model in advertising, which can be described by 8 steps: A — Attention, I — Interest, S — Search, D — Desire, A — Action, L — Like/dislike, S — Share and love/hate. The mentioned simple words describe the long process of the target consumer audience paying attention to the advertising announcement. It also shows the interest in the advertised product or brand, then searches the information about it. After this stage, it forms the desire and attitude for the product or brand. The next stage is the action. On this stage the consumer audience elects the brand, purchasing the product with an objective to satisfy the desire. Once the product testing is finished, the next stages can be analyzed as they show the consumer's like or dislike. The consumers may also express their feelings of likes or dislikes by sharing their thoughts and impressions among other consumers directly or through media. As for the last stage, this diagram describes the long-term feelings of consumer audience towards this particular brand or product.


