Data Flow Diagrams
With ConceptDraw DIAGRAM you can design professional flow chart diagrams, as well as:
- Unified Modeling Language (UML) diagrams
- Entity Relationship Diagrams (ERD)
- Data Flows Diagrams (DFD)
- Structured Systems Analysis and Design Method (SSADM)
- Windows and Macintosh Graphics User Interface (GUI) design
ConceptDraw DIAGRAM enables you to quickly create data flow diagrams that include data storage, external entities, functional transforms, data flows, and control transforms and signals.

All information systems manage the flow of data introduced into the system. The visualization of data flows represents the activity of data moving and transforming as it moves through a defined business system.
Complex information systems contain data flows which can be represented as a data flow diagram. Data flow diagrams enable you to visualize the data flow as well as it provides you the ability to analyze and make modifications to business systems.
With ConceptDraw DIAGRAM it is easy to create a data flow diagram from the supplied shapes located in the Object Library. The Object Library contains a large number of shapes that can be used to represent data flows, processes, data storage, objects and other data flow entities.

Solutions from the Software Development Area of ConceptDraw Solution Park extend ConceptDraw DIAGRAM (or later) comes with hundreds of work templates and an extensive range of libraries that give you the ability to represent your models. With ConceptDraw DIAGRAM you can quickly create a diagram and then export it to many graphic formats, including Microsoft PowerPoint.
NINE RELATED HOW TO's:
Electrical Engineering Solution used together with ConceptDraw DIAGRAM drawing facilities makes short a work of drawing various electrical and electronic circuit schemes. A library of vector objects composed from symbols of Analog and Digital Logic elements of electric circuit includes 40 symbolic images of logic gates, bistable switches of bi-stable electric current, circuit controllers, amplifiers, regulators, generators, etc. All of them can be applied in electronic circuit schemes for showing both analog and digital elements of the circuit.
Electrical Engineering Solution used together with ConceptDraw DIAGRAM drawing facilities makes short a work of drawing various electrical and electronic circuit schemes. A library of vector objects composed from symbols of Analog and Digital Logic elements of electric circuit includes 40 symbolic images of logic gates, bistable switches of bi-stable electric current, circuit controllers, amplifiers, regulators, generators, etc. All of them can be applied in electronic circuit schemes for showing both analog and digital elements of the circuit.
Picture:
Electrical Diagram Symbols F.A.Q.
How to Use Electrical ConceptDraw Diagram Software
Related Solution:
Venn Diagrams visualize all possible logical relations between several sets and are widely used in mathematics, logic, statistics, marketing, sociology, etc.
This Venn Diagram shows the relative complement of the set A with respect to the set B. It is the set of the elements in B, but not in A. In other words it is the set-theoretic difference B-A.
Picture:
Basic Circles Venn Diagram
Venn Diagram Example
Related Solution:
The activity of any organization is more or less branchy network of processes. The description of these processes is a hard technical task which requires definite methodology and standards.
According to the IDEF0 standard any process can be described in the form of a block (Activity Box) which has inputs and outputs. The process consists in transformation of inputs into outputs under the influence of the management and in the presence of necessary resources. Outputs of the given process later on can be either inputs for the next process or resources, or management means.
Picture: IDEF0 standard with ConceptDraw DIAGRAM
Related Solution:
Use Case Diagrams describes the functionality provided by a system in terms of actors, their goals represented as use cases, and any dependencies among those use cases.
Picture: Diagramming Software for Design UML Use Case Diagrams
Competitor analysis is a first and obligatory step in elaboration the proper corporate marketing strategy and creating sustainable competitive advantage. Use powerful opportunities of numerous solutions from ConceptDraw Solution Park for designing illustrative diagrams, charts, matrices which are necessary for effective competitor analysis.
Picture: Competitor Analysis
Related Solution:
This sample was created in ConceptDraw DIAGRAM diagramming and vector drawing software using the Workflow Diagrams Solution from the Software Development area of ConceptDraw Solution Park.
This sample shows the Workflow Diagram that clearly illustrates stages a BPM consists of and relations between all parts of business. The Workflow Diagrams are used to represent the transferring of data during the work process, to study and analysis the working processes, and to optimize a workflow.

Picture: Software Work Flow Process in Project Management with Diagram
Related Solution:
ConceptDraw DIAGRAM is a flowchart design software. There are large collections of professional flowchart symbols for process flow diagrams, standard flowchart symbols and colored basic flowchart symbols. Built-in examples and video lessons allow users to get started immediately and do drawing of virtually any type of flowchart or process flow diagrams
Picture: Flow Chart Creator
Related Solution:
Astronomy solution provides the Stars and Planets library with wide variety of solar system symbols. You can find here vector objects of solar system, of stars and planets of the universe.
To quickly draw any astronomy illustration: create new document and simply drag the needed solar system symbols from the Stars and Planets library, arrange them and add the text. You can also use the predesigned templates and samples from the ConceptDraw STORE as the base for your own sun solar system illustrations, astronomy and astrology drawings.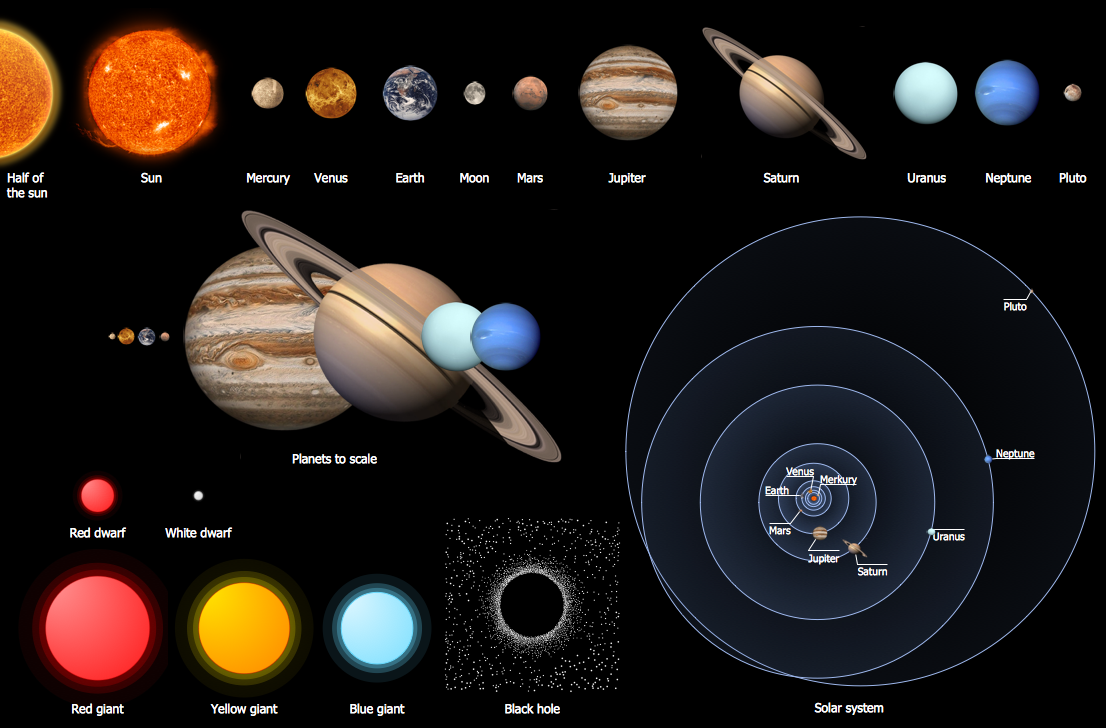
Picture: Solar System Symbols
Related Solution:
It's very simple, convenient and quick to design professional looking Flowcharts of any complexity using the ConceptDraw DIAGRAM diagramming and vector drawing software extended with Flowcharts Solution from the Diagrams Area of ConceptDraw Solution Park which provides a wide set of predesigned objects, templates, samples and Flowchart examples.
Picture: Flowchart Examples
Related Solution:
