Project Reports — Resource Usage, Weekly
In order to enable the organization to achieve its main goals the expenses of resources gained from the external environment are required. But in conditions of competition and market economy successfully operate only those companies and businesses that use their resources effectively and on purpose. Speaking about the projects, in modern conditions for successful project implementation the great value has not only a clear plan and scope of work, but also ensuring the rational use of human and material resources, particularly labor resources that are the main motivating resources for each company. The realization of rational use of resources and increase of competitiveness of an enterprise are achieved through the elimination the lost of working time, conduction the specialized activities to enhance the labor productivity, as well as improvement the control and monitoring. One of effective means of control are various types of reports, among them weekly, monthly, quarterly, yearly reports. They allow to study and evaluate the sufficiency by resources the enterprise as a whole and its structural divisions in particular, and also efficiency of their use. Besides, the reports allow to analyze the financial situation of an enterprise, the effectiveness of use of labor resources and the labor productivity.
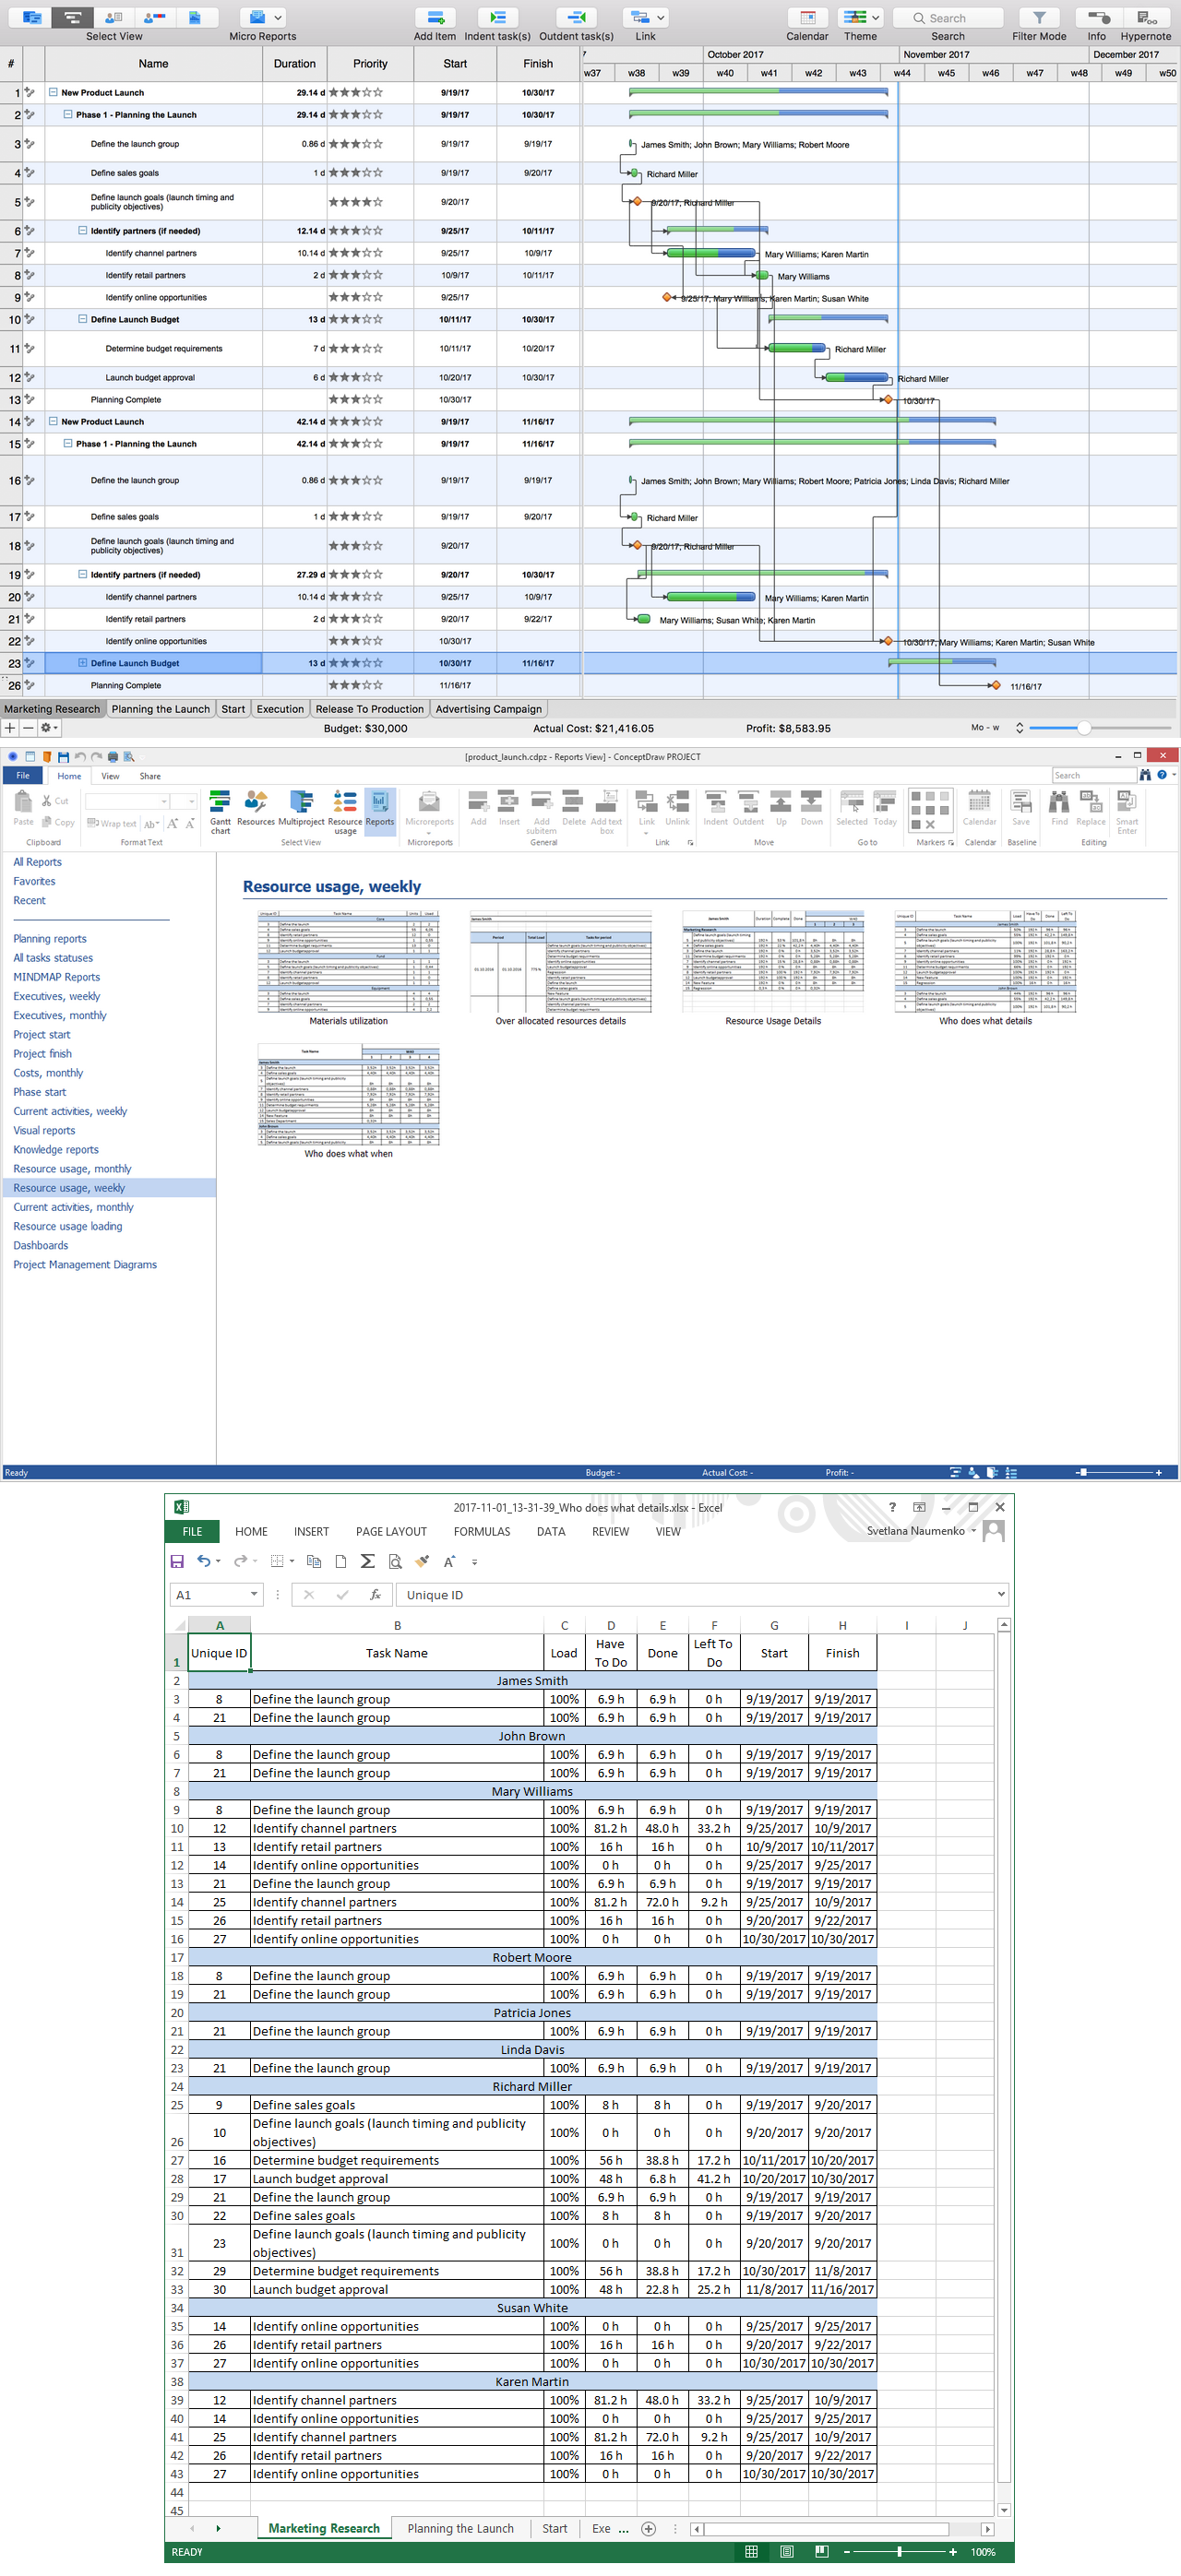
Pic 1. Project Reports — Resource Usage, Weekly
Powerful software in a field of project management ConceptDraw PROJECT offers a lot of tools for planning and execution different projects, and also creation varied reports in a few minutes. The "Resource usage, weekly" group of reports represented on the Reports toolbar at the Reports drop-down menu lets create the following types of reports:
- Materials utilization
- Over allocated resources details
- Resource Usage Details
- Who does what details
- Who does what when.
The “Materials utilization” item lets report exclusively the table of material resources utilization by tasks for each project for the current week. Under the name of each resource at the report you will see the list of tasks assigned to it in a defined project. Containing the Units, Used and Left columns, this table represents at them the values depending on the tasks’ complete values. For example, if a certain task has 10 units and is completed on 80%, the Used value equals 8 and Left value equals 2. Each project from the multiproject is represented on a separate sheet, a reporting period can be also customized.
The “Over allocated resources details” item reports the table of overallocation periods with task assignments for each employee, so you will see only the tasks on which resources are overallocated (with allocation more than 100%, i.e. 101% and over). This can be the situation when some resource is involved in two different tasks on the same day. You can track this at the Period column of the report. This type of report is one of the most useful and assists in efficient resources allocation within a project and company as a whole. Each project is represented on its own sheet at the report.
The “Resource Usage Details” item allows making the report with a table of resource usage details for the current week. Each resource is represented on its own sheet at the report. Under the project’s name you will see the list of tasks on which is assigned a given resource. The value at the Done column directly depends from the values at the Duration and Complete columns. You can specify another project period, if needed.
The “Who does what details” item lets generate the report containing a table of tasks with statuses per employees for each project for the current week. This report offers all information that you will see at the “Over allocated resources details” report and additionally contains the Done and Left to do columns. Done column represents the information about the quantity of man–hours spent relatively to Complete, Left to do column narrates about the remaining hours. The report includes the separate pages for the projects, the project period can be also changed.
The “Who does what when” item reports the table of daily tasks assignments of employees during the current week for each project. At this report you will see the resources involved in a project and the corresponding tasks, the project timeline and the time spent on each task from day to day. This report is the most popular and gives highly important information about implementation of your project. Each project will be represented on a separate sheet and the reporting period can be set different from the default.