Project Reports — Current Activities, Weekly
During the project implementation, any project manager and top executives need to get the information and data on current activities and project state on a regular basis. This data is necessary in order to see the overall project state at the moment, the degree of its implementation regarding the control points, as well as to identify and analyze the difficulties associated with project implementation, if there are any.
The reports on current activities intend to obtain the information on project tasks that have different fulfillment status: completed tasks, unstarted tasks, the tasks that will be executed soon or the tasks delayed over the base plan. The reports containing the data of these types give us the comprehensive information about the project status at a given moment. The clear, laconic and capacious report on the current activities and project status confirms the clarity and lack of chaos in a company, and also allows the manager to spend a few seconds only for a quick view to determine the work progress on this project.
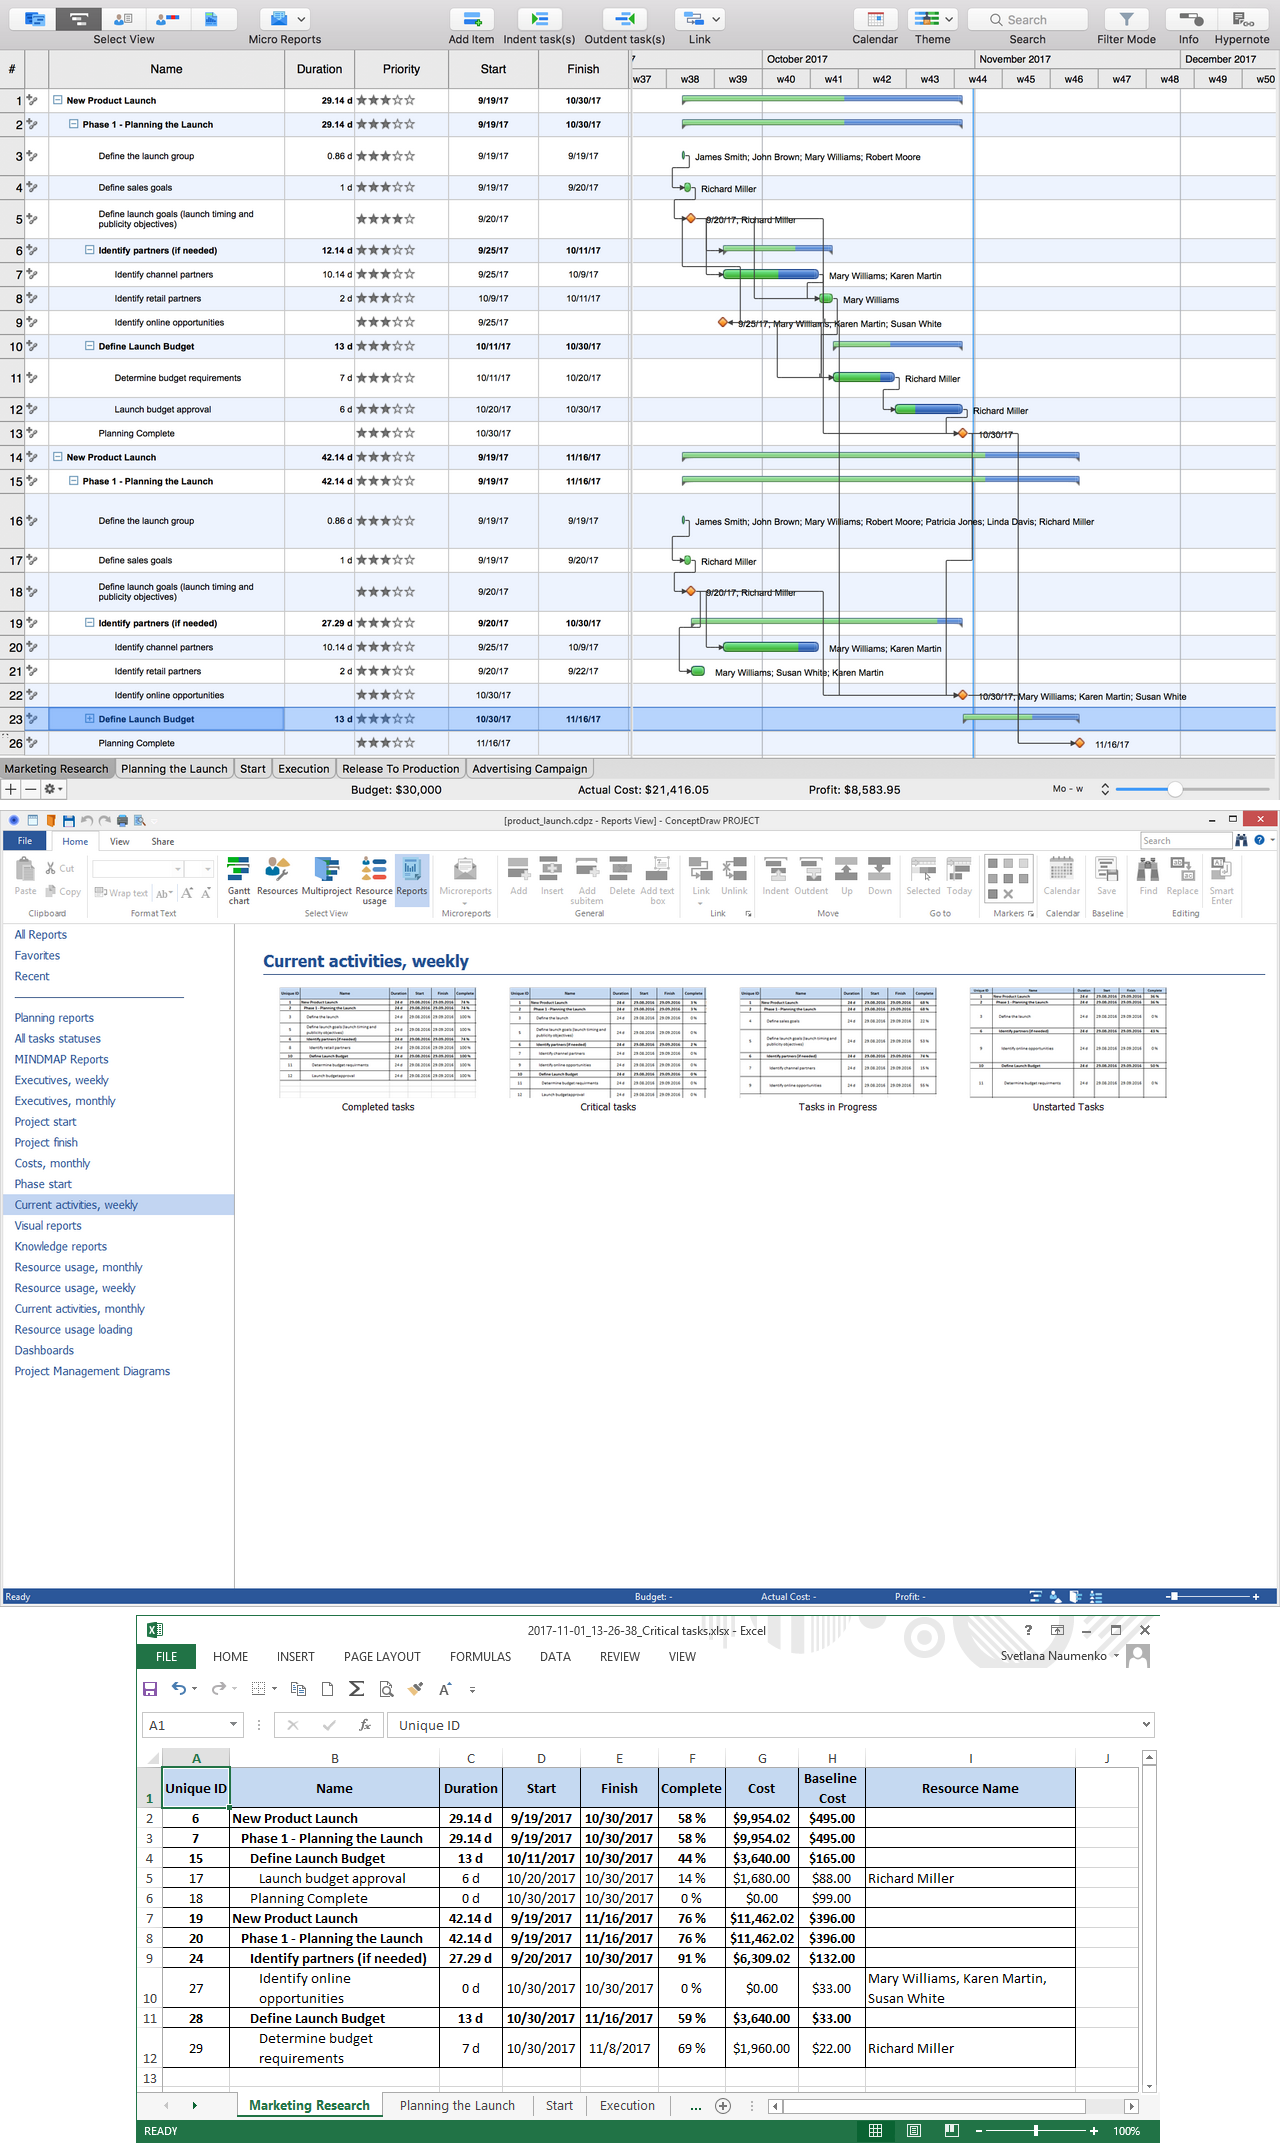
Pic 1. Project Reports — Current Activities, Weekly
ConceptDraw PROJECT software provides a great variety of useful tools developed specially for users' comfort in planning and managing different projects. Among other features, it offers a set of predefined reports that you can use as it is or customize to your reporting period. Various types of reports are often complementary, some reports present the general information about the project, other are more detailed by including particular information regarding characteristics, statuses, and settings. The group of “Current activities, weekly” reports is represented in ConceptDraw PROJECT software on the Reports toolbar from the Reports drop-down menu and offers four types of reports:
- Completed tasks,
- Critical tasks,
- Tasks in Progress,
- Unstarted Tasks.
The “Completed tasks” item produces the table of completed tasks (with 100% Complete) for each project for the current week. Optionally the reporting period can be changed to a desired one at the Reports dialog available from the Reports drop-down menu on the Reports toolbar in the program. Each project from the multi-project is represented on a separate sheet.
The “Critical tasks” item reports the table containing the critical tasks for each project for the current week, it is a default project period that can be changed at any moment. Critical path is a task or a sequence of tasks that define the project's end date. With increasing duration of a task that lies on a critical path, the project's duration will also increase, with decreasing it will decrease accordingly. This type of report is incredibly useful for critical path analysis that is a powerful project management tool especially for complex projects and lets identify the minimum length of time needed to complete a project. When the Critical Path option is checked in ConceptDraw PROJECT, the critical tasks are highlighted with red color on a project Gantt Chart.
The “Tasks in Progress” item allows reporting the table with all tasks in progress along with the detailed related information regarding these tasks. The tasks in progress are the tasks completed from 1% to 99%. By default, this report is generated for the current week, but you can change the reporting period if you need. The report will contain the separate pages for all projects from the multi-project.
The “Unstarted Tasks” item generates the report with a table of all unstarted tasks in the project for the current week, these are the tasks with 0% Complete. You can change the project period if you desire, the report document will have several sheets for the multi-project — each project report will be represented on an individual sheet.