Project Reports — MINDMAP Reports
One of the main responsibilities of any project manager is to track and analyze how the project is progressing, and to report the results to higher management. There exists a wide variety of report kinds, which can be chosen based on the individual project needs at the moment or interests of stakeholders, because in different projects and situations various information and data on the project are key and relevant.
ConceptDraw PROJECT gives you the opportunity to generate the incredible number of different reports and export them equally quickly and easily in MS Excel, ConceptDraw DIAGRAM or ConceptDraw MINDMAP A group of reports displayed in ConceptDraw MINDMAP deserves a special attention because this method of representation gives an additional visibility to your report, allows you to present important information in a clear, concise and visual form. In many cases a drawing, picture or diagram is easier for comprehension than a strict table, and the information presented on it is easier to remember. That is why a Mind map is a visual and so liked way to represent different information.
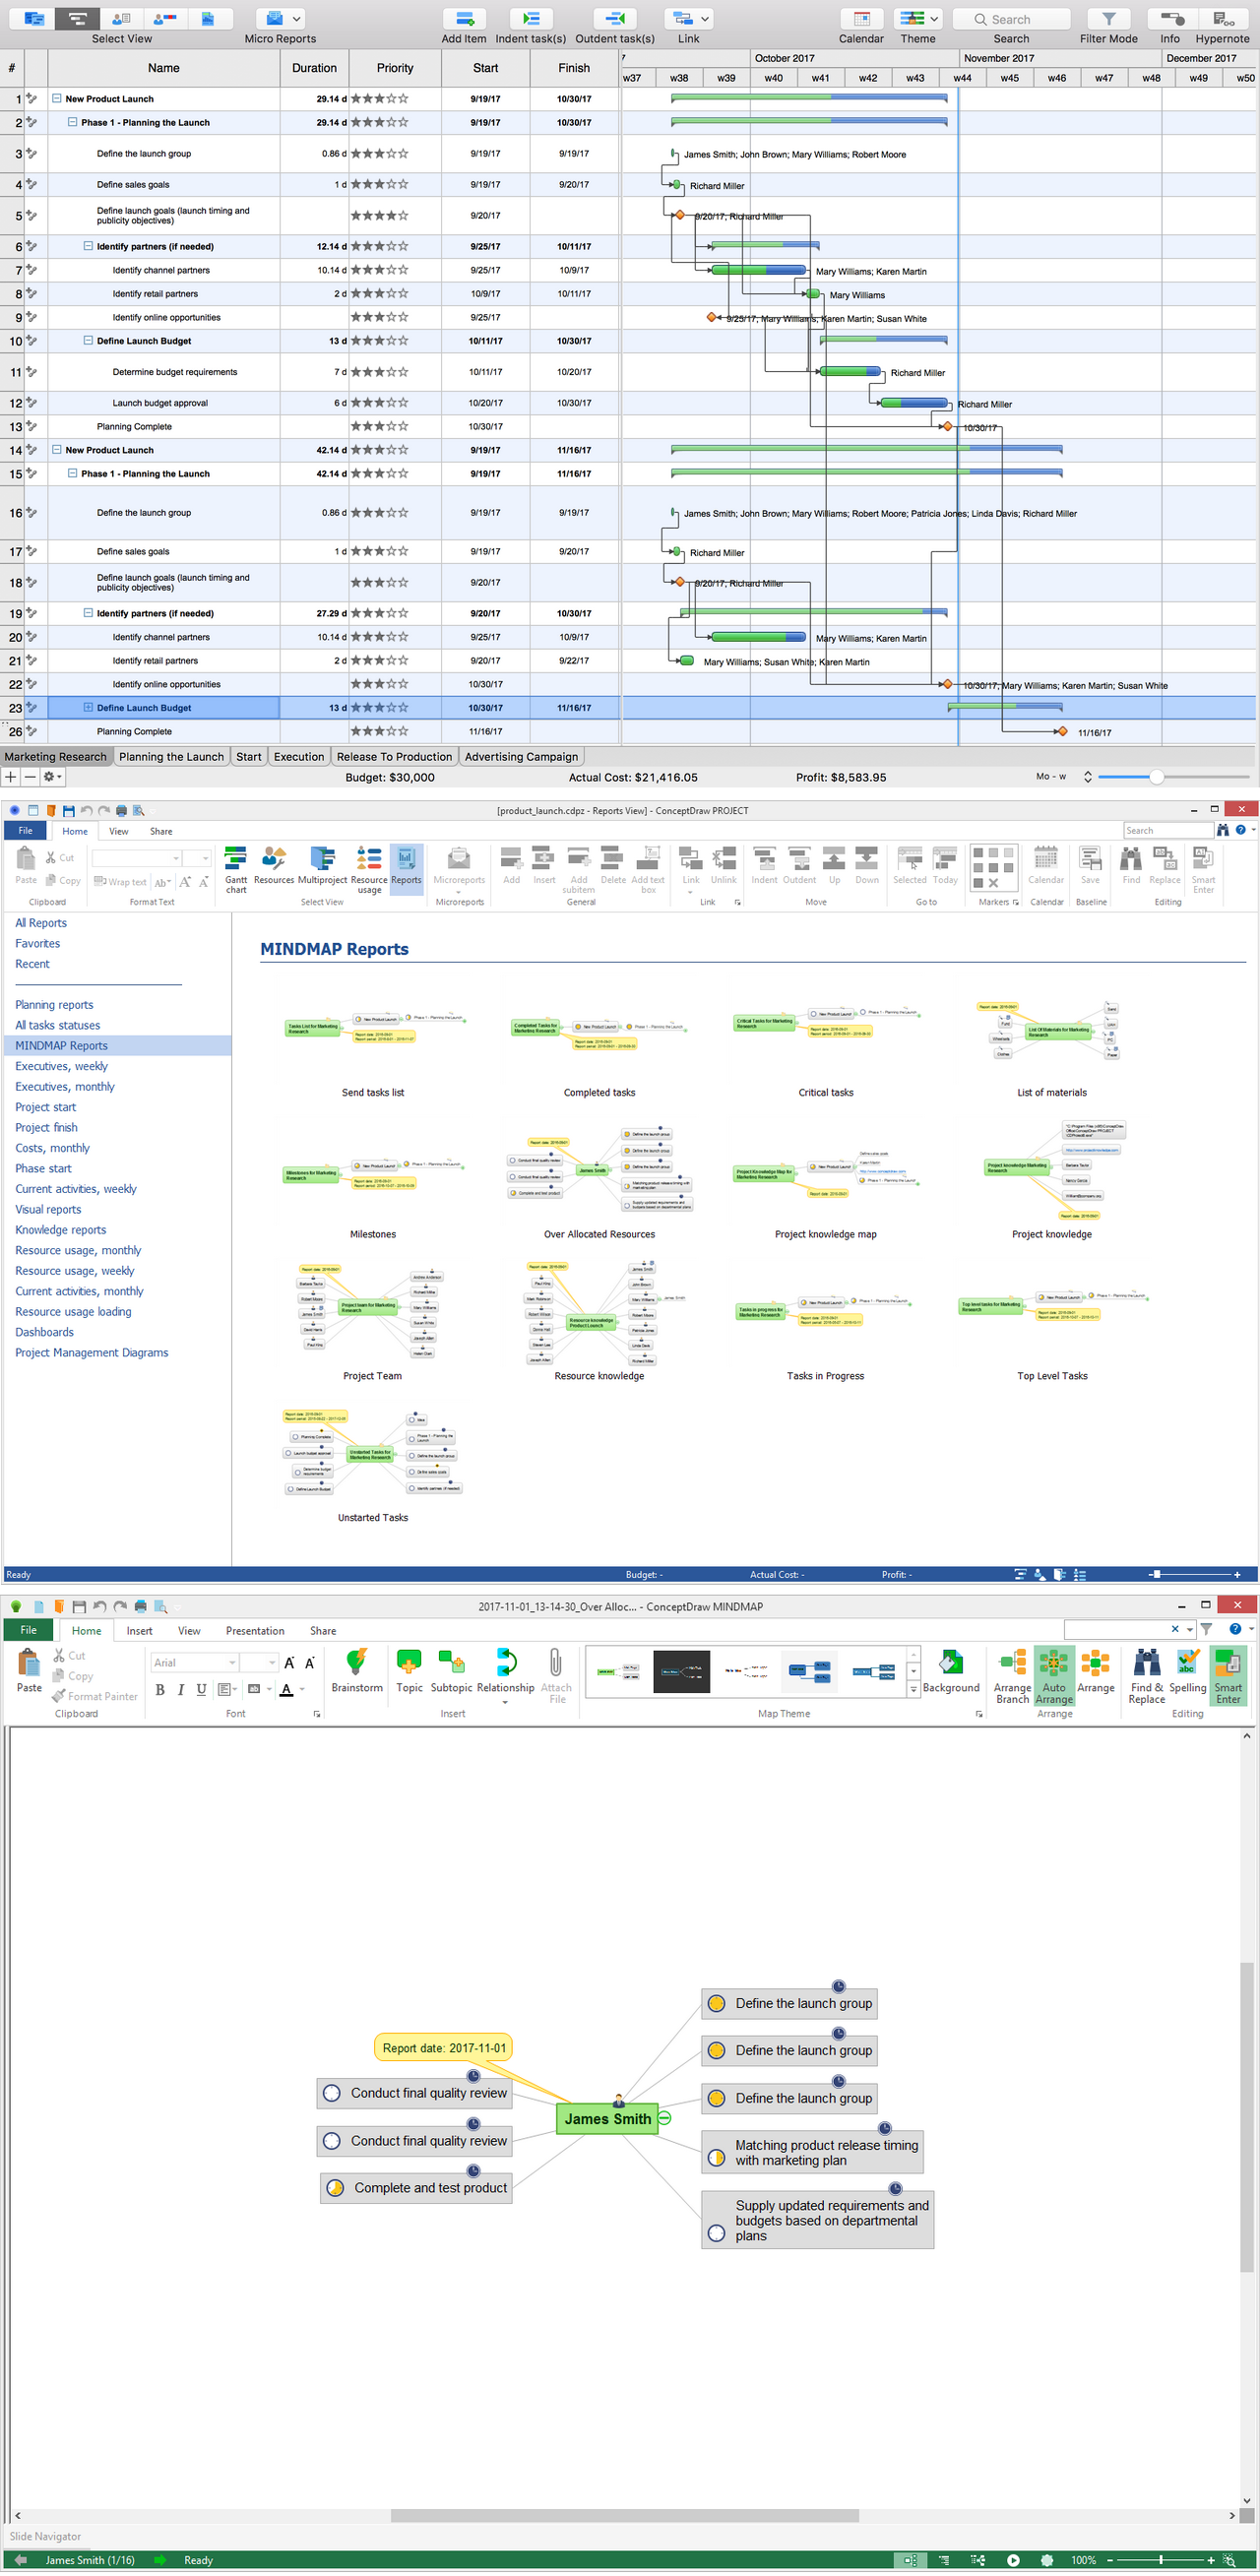
Pic 1. Project Reports — MINDMAP Reports
The group of MINDMAP reports is available in ConceptDraw PROJECT from the Reports drop-down list on the Reports toolbar. It represents the following types of reports for choice:
- Send tasks list
- Completed tasks
- Critical tasks
- List of materials
- Milestones
- Over Allocated Resources
- Project knowledge map
- Project knowledge
- Project Team
- Resource knowledge
- Tasks in Progress
- Top Level Tasks
- Unstarted Tasks.
The “Send tasks list” item allows reporting the hierarchy of all phases and tasks of each project in a form of Mind Map. The detailed information for each task, such as start and finish dates, duration, complete, priority, is displayed as a text note and becomes visible when dragging the mouse cursor over the corresponding icon. You will also see the report date and reporting period, by default it is a current month, but you can change it to a desired one at the Reports dialog, which can be opened from the Reports drop-down menu on the Reports toolbar at the program by clicking the Customize report command.
The “Completed tasks” item lets generate the report with completed tasks for each project for the current week in a form of Mind Map. The reporting period can be changed, if you desire. For the multiproject there will be created a multipage Mind Map document, in which the reports for different projects will be represented on the separated pages.
The “Critical tasks” item generates the report Mind Map illustrating the critical tasks for each project from the multiproject on the individual pages. The critical tasks are the tasks that lie on the project critical path and affect the project finish date. The critical path is visually highlighted with red on a project Gantt Chart in ConceptDraw PROJECT, if the Critical Path option is checked. By default, the reporting period is a current month, but you can choose any other desired.
The “List of materials” item allows creating the report in a form of Mind Map displaying the used material resources for each project. The reporting period can be changed from the current month set as default on another one, if needed. The report for each project from the multiproject will be represented as a separate Mind Map on the individual page at the report document.
The “Milestones” item generates the Mind Map report from the tasks marked as milestones at your project. The report is created for each project in case of multiproject and displays them on the separate sheets. The reporting period can be changed in accordance with your desire. The “Over Allocated Resources” item reports the Mind Maps of employees with their tasks for each overloaded employee, i.e. with a load over 100% (101% and more).
The “Project knowledge map” item lets represent on a Mind Map the tree of all project tasks with detailed information on them and includes the subtopics with hyperlinks related to them in the project.
The “Project knowledge” item generates the report containing the hyperlinks associated with a whole project for a given project and represent those hyperlinks as main topics on a Mind Map.
The “Project Team” item produces the Project Team Report that represents the employees (work resources) involved in a project, which have assigned tasks. It includes the information about their cost per hour that is displayed when you put the mouse cursor on a human resource pictogram, and also their e-mail addresses represented in a form of active hyperlinks. For multiproject, you will receive the multi-page Mind Map document representing the team report for each project on its own page. You can also change the reporting period to another one, if needed.
The “Resource knowledge” item reports the Mind Map formed from all resources of work type that this project or multiproject contains, with depiction the corresponding hyperlinks on the resources’ e-mails for those resources that have them or without this information in the opposite case.
The “Tasks in Progress” item lets report the project phases and tasks in progress on a Mind Map, i.e. the tasks and phases with tasks, completion of which is from 1% to 99%. By dragging the mouse pointer on the pictograms at the top of topics, you will see detailed information regarding these tasks. When creating this report for multiproject, you will receive the report for each project on a separate sheet of multipage Mind Map document. The default reporting period is a current month, but you can customize it at the Reports dialog, if needed.
The “Top Level Tasks” item generates the report in a form of Mind Map from the project top level phases and tasks. At the reporting for multiproject the information according to each project is represented on a separated sheet. This type of report lets change the reporting period on any desired from the offered by the program.
The “Unstarted Tasks” item allows generating the Mind Map report displaying all project tasks, which are unstarted (with 0% Complete), by default for a current month, but this period can be changed according to your desire. The unstarted tasks are represented with the corresponding phases, if they are on a project Gantt Chart. The report generated for the multiproject consists of several pages, each of them contains the report for one project from this multiproject.