Gantt Chart
The visual reports are the godsend for project management, they help represent the strict numbers and data about the results of project execution in a clear, visual and profitable view. They give the perfect ability to identify and display the most important data on one diagram, they let easily observe the project on different levels of detailing, demonstrate the project attributes, properties and other parameters.
ConceptDraw PROJECT software covers the entire spectrum of project management and reporting needs. It offers the tools for project development, managing and analysis, as well as for creating visual reports of different kinds that can help pick and visualize various aspects of your project. And due to the compatibility of ConceptDraw PROJECT and ConceptDraw DIAGRAM the users have an excellent possibility to make the visual project reports in a form of professionally designed diagrams.
The series of buttons available at the Project Diagrams section on the Reports toolbar in ConceptDraw PROJECT software enables generating any of nine prebuilt types of reports in seconds. Simply click on a diagram’s icon and the corresponding diagram report will be generated on the base of your project data, and will open in ConceptDraw DIAGRAM application in a presentation mode. The Gantt Chart button is also available from the Reports tab of the program, it helps generate the Gantt Chart report diagram and represent the basic view of the current project or all projects from the multi-project in this diagram. This type of visual reporting is the most extensive among the rest of reports, it is incredibly helpful at the early stages of the project’s discussion, as well as on the later ones.
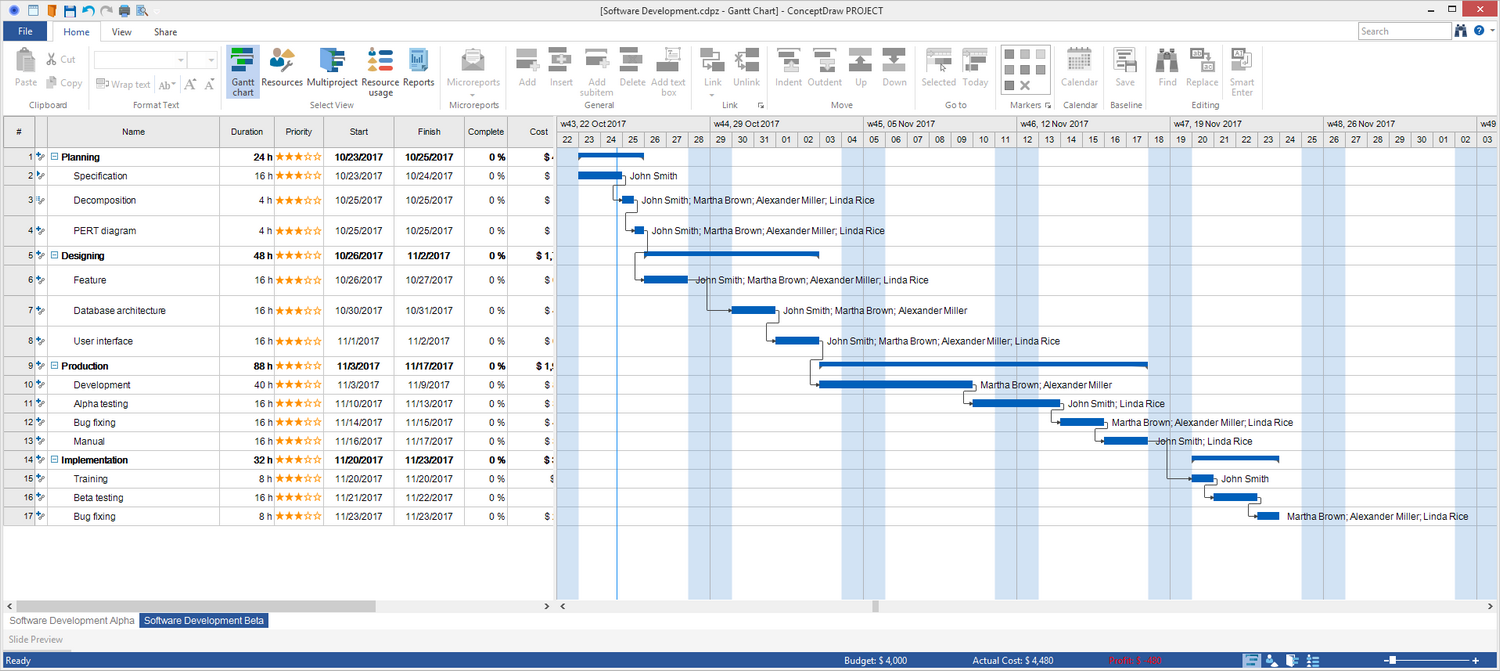
Pic 1. ConceptDraw PROJECT — Gantt Chart
The Gantt Chart visual diagram displays the table of project’s tasks at the left side, the outline level of which is equal or less than two and at the right side - graphical bars representing the tasks, their time frames and degrees of their complete in percent. You will also see the milestones and the information about all resources assigned to the displayed tasks.
The Gantt Chart diagram report for multi-project is represented in ConceptDraw DIAGRAM in a presentation mode and consists of the report pages for each project from this multi-project, and also includes the page with a basic multi-project view. The presentation mode is quite useful for demonstration your Gantt Chart report to the colleagues and other stakeholders on your computer’s or notebook’s monitor, or on a large screen according to your desire.