 Data Flow Diagrams (DFD)
Data Flow Diagrams solution extends ConceptDraw PRO software with templates, samples and libraries of vector stencils for drawing the data flow diagrams (DFD).
 Workflow Diagrams
Workflow Diagrams solution extends ConceptDraw PRO software with samples, templates and vector stencils library for drawing the work process flowcharts.
HelpDesk
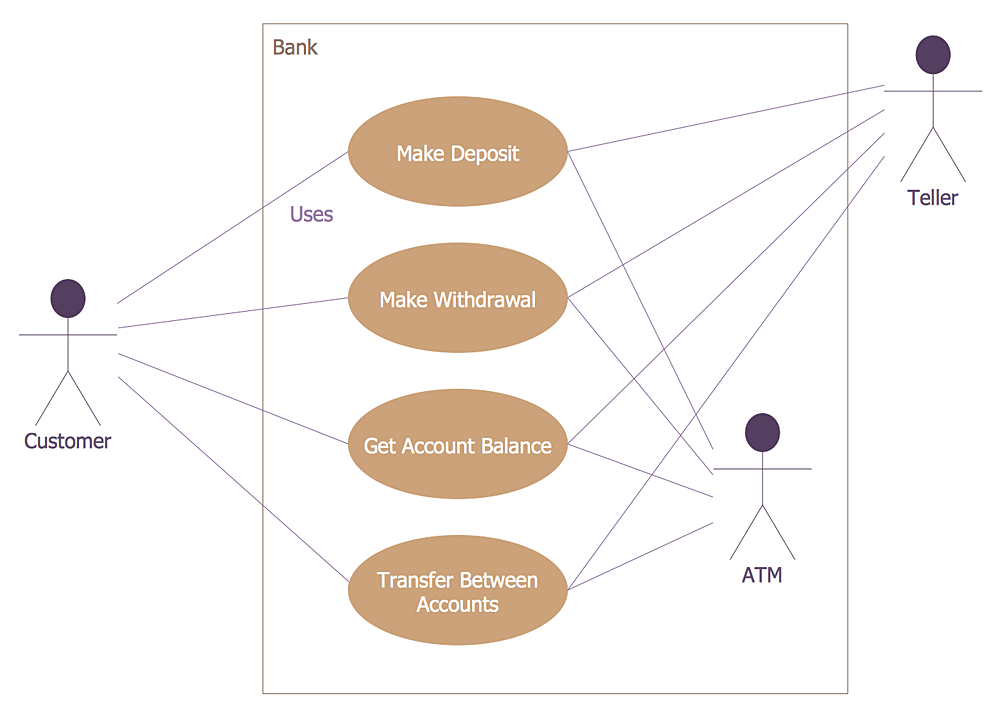
How to Create a Bank ATM Use Case Diagram
UML diagrams are often used in banking management for documenting a banking system. In particular, the interaction of bank customers with an automated teller machine (ATM) can be represented in a Use Case diagram. Before the software code for an ATM, or any other system design, is written, it is necessary to create a visual representation of any object-oriented processes. This is done most effectively by creating a Unified Modeling Language (UML) diagram, using object-oriented modeling. UML works as a general purpose modeling language for software engineers or system analysts, offering a number of different diagram styles with which to visually depict all aspects of a software system. ConceptDraw PRO diagramming software, enhanced and expanded with the ATM UML Diagrams solution, offers the full range of icons, templates and design elements needed to faithfully represent ATM and banking information system architecture using UML standards. The ATM UML Diagrams solution is useful for beginner and advanced users alike. More experienced users will appreciate a full range of vector stencil libraries and ConceptDraw PRO's powerful software, that allows you to create your ATM UML diagram in a matter of moments.
 Cross-Functional Flowcharts
Cross-functional flowcharts are powerful and useful tool for visualizing and analyzing complex business processes which requires involvement of multiple people, teams or even departments. They let clearly represent a sequence of the process steps, the order of operations, relationships between processes and responsible functional units (such as departments or positions).
 Cisco Network Diagrams
Cisco Network Diagrams solution extends ConceptDraw PRO software with samples, templates and libraries of vector stencils for drawing the Cisco computer network diagrams.
 ATM UML Diagrams
The ATM UML Diagrams solution lets you create ATM solutions and UML examples. Use ConceptDraw PRO as a UML diagram creator to visualize a banking system.
 Interactive Voice Response Diagrams
Interactive Voice Response Diagrams solution extends ConceptDraw PRO v10 software with samples, templates and libraries of ready-to-use vector stencils that help create Interactive Voice Response (IVR) diagrams illustrating in details a work of interactive voice response system, the IVR system’s logical and physical structure, Voice-over-Internet Protocol (VoIP) diagrams, and Action VoIP diagrams with representing voice actions on them, to visualize how the computers interact with callers through voice recognition and dual-tone multi-frequency signaling (DTMF) keypad inputs.
 Fishbone Diagrams
The Fishbone Diagrams solution extends ConceptDraw PRO v10 software with the ability to easily draw the Fishbone Diagrams (Ishikawa Diagrams) to clearly see the cause and effect analysis and also problem solving. The vector graphic diagrams produced using this solution can be used in whitepapers, presentations, datasheets, posters, and published technical material.
- UML class diagram - Bank account | Data Flow Diagrams (DFD ...
- Process Flowchart | Audit Flowcharts | Data Flow Diagrams (DFD ...
- Data Flow Diagram For Bank Saving Account Process
- Process Flowchart | Data Flow Diagrams (DFD) | Flowchart on Bank ...
- Business Process Diagrams | HR workflow - Vector stencils library ...
- DFD - Process of account receivable | UML package diagram for ...
- Process Flowchart | Interactive Voice Response Diagrams ...
- Flowchart on Bank . Flowchart Examples | Workflow Diagrams ...
- UML use case diagram - Banking system
- Control Flow Diagram Of Banking System
- Data Flow Diagrams (DFD) | Audit Flowcharts | Cross-Functional ...
- Process Flowchart | Banking And Insurance Diagrams
- Flowchart on Bank . Flowchart Examples | UML Sequence Diagram ...
- Flow Chart Organisation Of A Bank
- Process Flowchart | How to Create a Bank ATM Use Case Diagram ...
- Process Flowchart | Design elements - Bank UML activity diagram ...
- Process Flowchart | Bank System | How to Create a Bank ATM Use ...
- UML class diagram - Bank account | ATM UML Diagrams | Data ...
- Online Banking System Swimlane Diagram
- UML use case diagram - Banking system | ConceptDraw PRO ER ...
