"Microsoft Windows 2000 Server introduces Active Directory to replace domain functionality. Active Directory will continue to get the job done, but in a much more efficient way. Active Directory can be replicated between multiple domain controllers, so no single system is critical. In this way, the crucial data stored within Active Directory is both redundant and load-balanced.
A directory, in the most generic sense, is a comprehensive listing of objects. A phone book is a type of directory that stores information about people, businesses, and government organizations. Phone books typically record names, addresses, and phone numbers. Active Directory is similar to a phone book in several ways, and it is far more flexible. Active Directory will store information about organizations, sites, systems, users, shares, and just about any other network object that you can imagine. Not all objects are as similar to each other as those stored in the phone book, so Active Directory includes the ability to record different types of information about different objects." [technet.microsoft.com/ en-us/ library/ bb742424.aspx]
The AD diagram example "Active Directory structure diagram" was created using the ConceptDraw PRO diagramming and vector drawing software extended with the Active Directory Diagrams solution from the Computer and Networks area of ConceptDraw Solution Park.
Active Directory network diagram
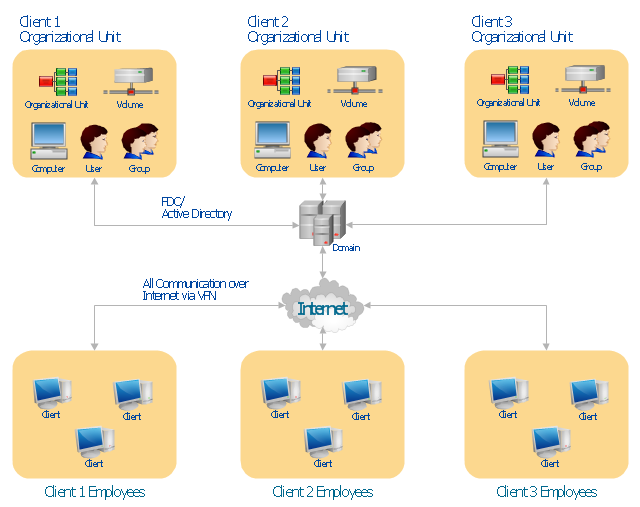
This Active Directory network diagram example depicts types of groups and people assignment rules.
Architecture groups in a Windows Active Directory 2003:
(1) The arrow indicates "may be a member of."
(2) Dotted: Functionality limited to Windows 2003 (without the Windows 2000 compatibility).
(3) Red: Setting possible, but not recommended.
It was drawn on the base of Wikimedia Commons file: AD2003.JPG. [commons.wikimedia.org/ wiki/ File:AD2003.JPG]
This file is licensed under the Creative Commons Attribution-Share Alike 3.0 Unported license. [creativecommons.org/ licenses/ by-sa/ 3.0/ deed.en]
The Active Directory network diagram example "Tree and Forest (Full Trust)" was created using the ConceptDraw PRO diagramming and vector drawing software extended with the Active Directory Diagrams solution from the Computer and Networks area of ConceptDraw Solution Park.
Active Directory network diagram
---active-directory-network-diagram.png--diagram-flowchart-example.png)
Active Directory Domain Services

HelpDesk
How To Create a MS Visio Telecommunication Network Diagram Using ConceptDraw PRO

 25 Typical Orgcharts
The 25 Typical Orgcharts solution contains powerful organizational structure and organizational management drawing tools, a variety of professionally designed organization chart and matrix organization structure samples, 25 templates based on various orga
 macOS User Interface
macOS User Interface solution extends the ConceptDraw PRO functionality with powerful GUI software graphic design features and tools. It provides an extensive range of multifarious macOS Sierra user interface design examples, samples and templates, and wide variety of libraries, containing a lot of pre-designed vector objects of Mac Apps icons, buttons, dialogs, menu bars, indicators, pointers, controls, toolbars, menus, and other elements for fast and simple designing high standard user interfaces of any complexity for new macOS Sierra.
 Area Charts
Area Charts are used to display the cumulative totals over time using numbers or percentages; or to show trends over time among related attributes. The Area Chart is effective when comparing two or more quantities. Each series of data is typically represented with a different color, the use of color transparency in an object’s transparency shows overlapped areas and smaller areas hidden behind larger areas.
 Quality Mind Map
This solution extends ConceptDraw MINDMAP software with Quality Management Mind Maps (Presentations, Meeting Agendas, Problem to be solved).
 Basic Line Graphs
This solution extends the capabilities of ConceptDraw PRO v10.3.0 (or later) with templates, samples and a library of vector stencils for drawing Line Graphs.
 Fishbone Diagrams
The Fishbone Diagrams solution extends ConceptDraw PRO v10 software with the ability to easily draw the Fishbone Diagrams (Ishikawa Diagrams) to clearly see the cause and effect analysis and also problem solving. The vector graphic diagrams produced using this solution can be used in whitepapers, presentations, datasheets, posters, and published technical material.
 Bar Graphs
The Bar Graphs solution enhances ConceptDraw PRO v10 functionality with templates, numerous professional-looking samples, and a library of vector stencils for drawing different types of Bar Graphs, such as Simple Bar Graph, Double Bar Graph, Divided Bar Graph, Horizontal Bar Graph, Vertical Bar Graph, and Column Bar Chart.
- Active Directory Diagram | Active Directory structure diagram ...
- Active Directory Diagram | Active Directory Domain Services ...
- Active Directory Diagram | Network Diagramming Software for ...
- Active Directory Domain Services | Design Element: Active Directory ...
- Active Directory Diagram | Active Directory structure diagram | How ...
- Active Directory Diagram | Active Directory structure diagram | Active ...
- Active Directory Diagram
- Active Directory Windows
- Active Directory Diagram | How to Create an Active Directory ...
- Active Directory Structure Diagram Example
- Active Directory Diagram | Active Directory Domain Services ...
- Active Directory Diagram | Active Directory structure diagram | Data ...
- Active Directory Domain Services diagram | Active Directory ...
- Network Diagramming Software for Network Active Directory Diagrams
- AD LDS as a phone book service | Active Directory structure ...
- Active Directory Diagrams
- Active Directory In Business Organization
- Active Directory Diagram
- Active Directory Diagram | Tree and Forest (Full Trust) - Active ...
- Active Directory Diagram | Design Element: Active Directory for ...