HelpDesk
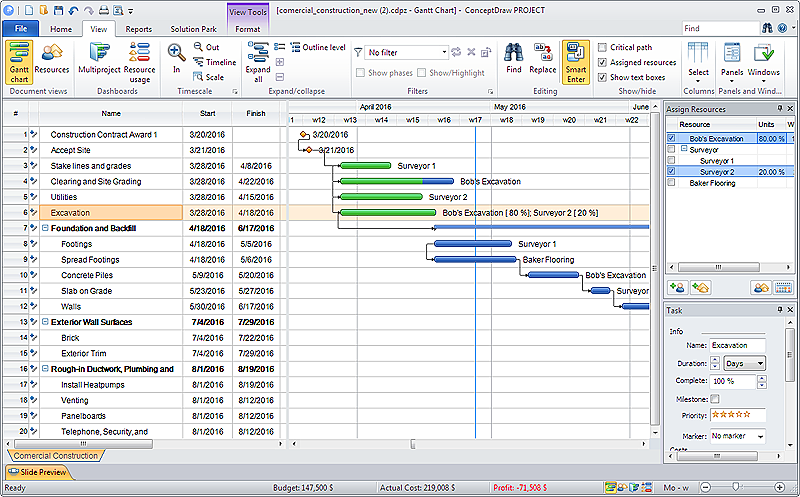
How to Draw a Gantt Chart Using ConceptDraw PRO
A Gantt chart is intended to provide a visualization of a project schedule. It is developed to help planning, coordinating, and tracking on project tasks implementation. One of the most critical resources for a project implementation is a time resources. Gantt chart - is one of the most convenient and popular way of graphical representation of a project tasks progress in conjunction with the corresponding time consumption. Gantt chart's function is to show project tasks completion in a progress, and to make a project manager sure that project tasks were completed on time. ConceptDraw Office is a clear and easy-to-use tool for project management. It is a very handy visual tool that helps make a project processing clear.HelpDesk
How to Plan and Allocate Resources in Your Project with ConceptDraw PROJECT for Windows
Effective resource management is a key factor in the successful project implementation. The common types of resources for which the project manager has an impact, include material resources (materials, energy), staff (work) and equipment. CoceptDraw PROJECT provides easy ways to project Resources Management: Create a list of project resources and assign the right human resource, as well as the necessary material, or equipment to be used.HelpDesk
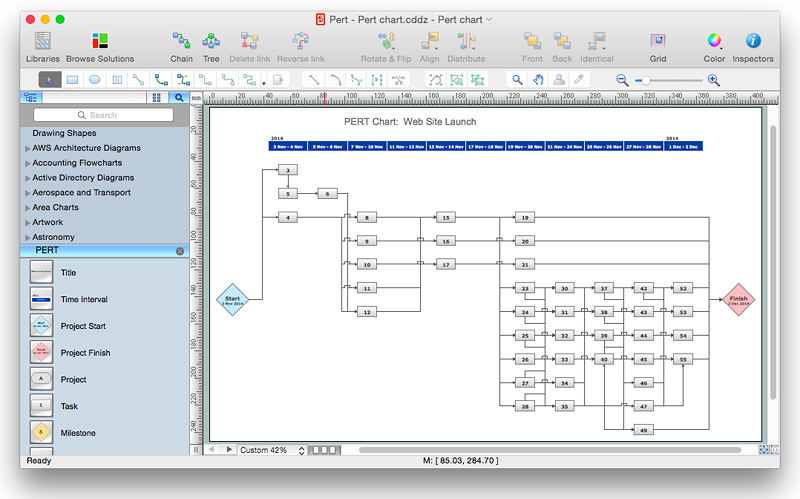
How to Create Project Diagrams on Mac
Diagrams are very useful for project implementation because they help teams visualize important details such as interrelations between tasks, critical paths, timelines, milestones, calendars, and also resource usage.HelpDesk
How to Track Your Project Plan vs. the Actual Project Condition
Conceptdraw PROJECT provides user with the possibility to track how the project is going. Project Manager can compare the actual data with the planned and assess possible measures to resolve issues. Conceptdraw PROJECT has several types of visual reports that can help to assess visually the difference between planned and actual project data.Software development with ConceptDraw Products
Internet solutions on ConceptDraw base. What may interest developers of Internet solutions.Collaboration in a Project Team
Create with our data flow diagram software perfect data flow diagrams. Download data flow diagram software for FREE. Use hundreds of data flow diagram examples.- Project Implementation Flow Chart
- Process Flowchart | Gantt chart examples | Gant Chart in Project ...
- Process Flowchart | How to Create Project Diagrams on Mac | How ...
- How to Create Project Diagrams on Mac | Process Flowchart | How ...
- Process Flowchart | Software development with ConceptDraw ...
- Process Flowchart | Basic Flowchart Symbols and Meaning | How To ...
- Project Implementation Plan Diagrams
- Process Flowchart | EPC for Business Process Implementation ...
- Project Management Impact Flowchart
- Gantt chart examples | How to Draw a Gantt Chart Using ...
- Process Flowchart | Project Implementation Flow Chart In Cleaning ...
- Gant Chart in Project Management | How To Plan and Implement ...
- How To Plan and Implement Projects Faster | Basic Flowchart ...
- How To Implement Collaborative Project Management
- CORRECTIVE ACTIONS PLANNING. PERT Chart | Process ...
- Project Proposal Of Education Flow Chart
- Application Of Grant Chart On Project Implementation
- Flow Chart Of Implementation Plan
- Project —Task Trees and Dependencies | Process Flowchart ...
- Process Flowchart | Basic Flowchart Symbols and Meaning | How to ...


