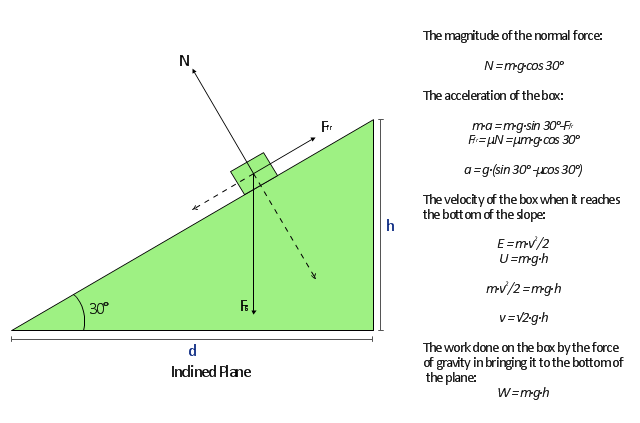
"A free body diagram, sometimes called a force diagram, is a pictorial device, often a rough working sketch, used by engineers and physicists to analyze the forces and moments acting on a body. The body itself may consist of multiple components, an automobile for example, or just a part of a component, a short section of a beam for example, anything in fact that may be considered to act as a single body, if only for a moment. A whole series of such diagrams may be necessary to analyze forces in a complex problem. The free body in a free body diagram is not free of constraints, it is just that the constraints have been replaced by arrows representing the forces and moments they generate." [Free body diagram. Wikipedia]
The free-body diagram example was created using the ConceptDraw PRO diagramming and vector drawing software extended with the Physics solution from the Science and Education area of ConceptDraw Solution Park.
The free-body diagram example was created using the ConceptDraw PRO diagramming and vector drawing software extended with the Physics solution from the Science and Education area of ConceptDraw Solution Park.
Free-body diagram
 Physics
Physics solution extends ConceptDraw PRO software with templates, samples and libraries of vector stencils for drawing the physical illustrations, diagrams and charts.
HelpDesk
How to Draw Physics Diagrams in ConceptDraw PRO
")
 Fishbone Diagram
Fishbone Diagrams solution extends ConceptDraw PRO software with templates, samples and library of vector stencils for drawing the Ishikawa diagrams for cause and effect analysis.
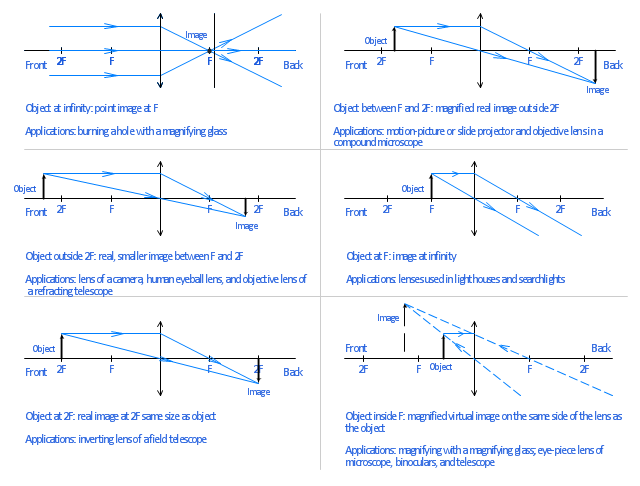
"A lens is an optical device which transmits and refracts light, converging or diverging the beam. A simple lens consists of a single optical element. A compound lens is an array of simple lenses (elements) with a common axis; the use of multiple elements allows more optical aberrations to be corrected than is possible with a single element. Lenses are typically made of glass or transparent plastic. Elements which refract electromagnetic radiation outside the visual spectrum are also called lenses: for instance, a microwave lens can be made from paraffin wax.
The variant spelling lense is sometimes seen. While it is listed as an alternative spelling in some dictionaries, most mainstream dictionaries do not list it as acceptable." [Lens (optics). Wikipedia]
The example "Ray tracing diagram for convex lens" was created using the ConceptDraw PRO diagramming and vector drawing software extended with the Physics solution from the Science and Education area of ConceptDraw Solution Park.
Ray tracing diagram
Network Printer


This circle diagram sample was redesigned from the Wikimedia Commons file: Research cycle.png. "Some of the basic elements of the scientific method, arranged in a cycle to emphasize that it is an iterative process." [commons.wikimedia.org/ wiki/ File:Research_ cycle.png]
This file is licensed under the Creative Commons Attribution 2.0 Generic license. [creativecommons.org/ licenses/ by/ 2.0/ deed.en]
"The scientific method is a body of techniques for investigating phenomena, acquiring new knowledge, or correcting and integrating previous knowledge. To be termed scientific, a method of inquiry must be based on empirical and measurable evidence subject to specific principles of reasoning. ...
Four essential elements of the scientific method are iterations, recursions, interleavings, or orderings of the following:
(1) Characterizations (observations, definitions, and measurements of the subject of inquiry).
(2) Hypotheses (theoretical, hypothetical explanations of observations and measurements of the subject).
(3) Predictions (reasoning including logical deduction from the hypothesis or theory).
(4) Experiments (tests of all of the above)...
A linearized, pragmatic scheme of the four points above is sometimes offered as a guideline for proceeding:
(1) Define a question.
(2) Gather information and resources (observe).
(3) Form an explanatory hypothesis.
(4) Test the hypothesis by performing an experiment and collecting data in a reproducible manner.
(5) Analyze the data.
(6) Interpret the data and draw conclusions that serve as a starting point for new hypothesis.
(7) Publish results.
(8) Retest (frequently done by other scientists).
The iterative cycle inherent in this step-by-step method goes from point 3 to 6 back to 3 again." [Scientific method. Wikipedia]
The circle diagram example "Research cycle" was created using the ConceptDraw PRO diagramming and vector drawing software extended with the Target and Circular Diagrams solution from the Marketing area of ConceptDraw Solution Park.
www.conceptdraw.com/ solution-park/ marketing-target-and-circular-diagrams
Circle diagram

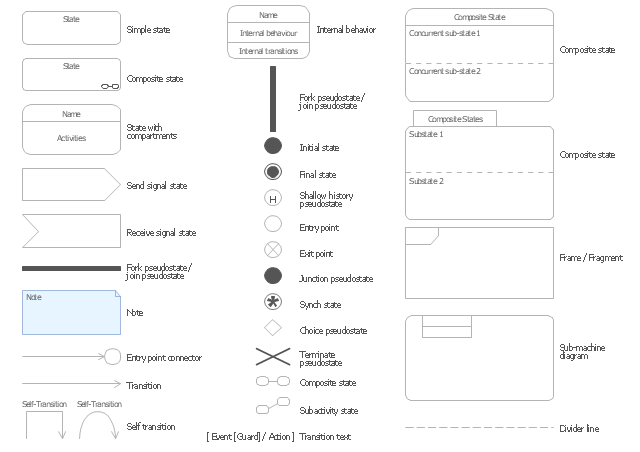
The vector stencils library "UML state machine diagrams" contains 35 symbols for the ConceptDraw PRO diagramming and vector drawing software.
"The state diagram in the Unified Modeling Language is essentially a Harel statechart with standardized notation, which can describe many systems, from computer programs to business processes. In UML 2 the name has been changed to State Machine Diagram. The following are the basic notational elements that can be used to make up a diagram:
(1) Filled circle, pointing to the initial state.
(2) Hollow circle containing a smaller filled circle, indicating the final state (if any).
(3) Rounded rectangle, denoting a state. Top of the rectangle contains a name of the state. Can contain a horizontal line in the middle, below which the activities that are done in that state are indicated.
(4) Arrow, denoting transition. The name of the event (if any) causing this transition labels the arrow body. A guard expression may be added before a "/ " and enclosed in square-brackets ( eventName[guardExpression] ), denoting that this expression must be true for the transition to take place. If an action is performed during this transition, it is added to the label following a "/ " ( eventName[guardExpression]/ action ).
(5) Thick horizontal line with either x>1 lines entering and 1 line leaving or 1 line entering and x>1 lines leaving. These denote join/ fork, respectively." [State diagram (UML). Wikipedia]
The example "Design elements - UML state machine diagrams" is included in the Rapid UML solution from the Software Development area of ConceptDraw Solution Park.
UML state machine diagram symbols
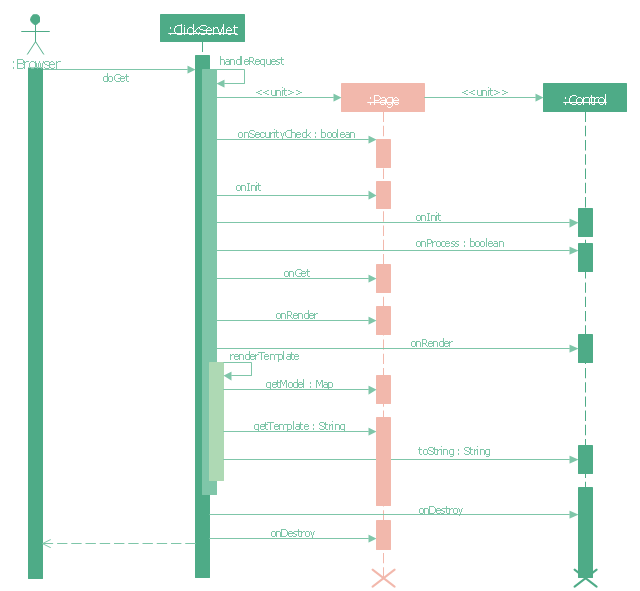
"Request methods.
An HTTP 1.1 request made using telnet. The request, response headers and response body are highlighted.
HTTP defines methods (sometimes referred to as verbs) to indicate the desired action to be performed on the identified resource. What this resource represents, whether pre-existing data or data that is generated dynamically, depends on the implementation of the server. Often, the resource corresponds to a file or the output of an executable residing on the server. The HTTP/ 1.0 specification:section 8 defined the GET, POST and HEAD methods and the HTTP/ 1.1 specification:section 9 added 5 new methods: OPTIONS, PUT, DELETE, TRACE and CONNECT. By being specified in these documents their semantics are well known and can be depended upon. Any client can use any method and the server can be configured to support any combination of methods. If a method is unknown to an intermediate it will be treated as an unsafe and non-idempotent method. There is no limit to the number of methods that can be defined and this allows for future methods to be specified without breaking existing infrastructure. For example, WebDAV defined 7 new methods and RFC5789 specified the PATCH method.
GET.
Requests a representation of the specified resource. Requests using GET should only retrieve data and should have no other effect. (This is also true of some other HTTP methods.)" [Hypertext Transfer Protocol. Wikipedia]
The UML sequence diagram example "GET request" was created using the ConceptDraw PRO diagramming and vector drawing software extended with the Rapid UML solution from the Software Development area of ConceptDraw Solution Park.
UML sequence diagram
- Free- body diagram
- Free- body diagram | Physics Diagrams | Physics | Examples With ...
- Free- body diagram | Physics Diagrams | How to Draw Physics ...
- Free- body diagram | Physics Diagrams | Physics | Concept Of Free ...
- Physics Diagrams | Fishbone Diagram | Physics | Online Free Body ...
- Free- body diagram | Pictorial Explanation Of Inclined Plane
- Fishbone Diagram | Health Food | Sales Flowcharts | Fish Body ...
- Free Body Diagram Drawing Software
- Free Body Diagram Mechanic
- Physics Diagrams | Free- body diagram | How to Draw Physics ...
- Physics | Physics Diagrams | Free Body Diagram Mechanics
- Free- body diagram | Pyramid Diagram | Physics Diagrams ...
- Physics Diagrams | Physics | Fishbone Diagram | Free Body ...
- Free- body diagram | Design elements - Mechanics | Inclined Plane ...
- Free- body diagram | Flow Diagram Software | Network Diagram ...
- Free Body Diagrams Examples
- Free Body Diagram Of Mos In Wikipedia
- Body Diagram Drawing Software
- Free Body Diagram Software
- Physics Diagrams | Physics | Cisco Design | Free Body Diagram ...