"The client–server model of computing is a distributed application structure that partitions tasks or workloads between the providers of a resource or service, called servers, and service requesters, called clients. Often clients and servers communicate over a computer network on separate hardware, but both client and server may reside in the same system. A server host runs one or more server programs which share their resources with clients. A client does not share any of its resources, but requests a server's content or service function. Clients therefore initiate communication sessions with servers which await incoming requests.
Examples of computer applications that use the client–server model are Email, network printing, and the World Wide Web." [Client–server model. Wikipedia]
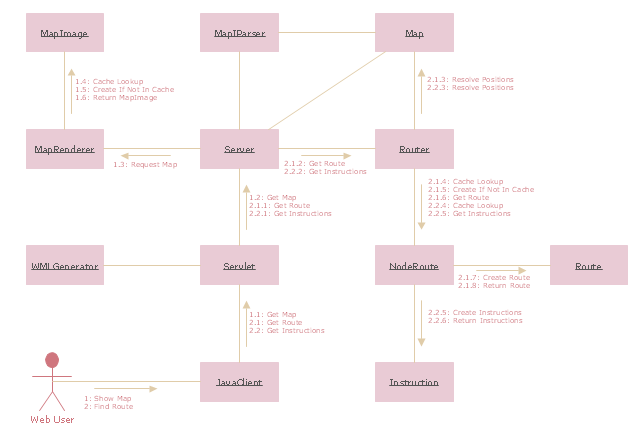
The UML communication diagram example "Client server access" was created using the ConceptDraw PRO diagramming and vector drawing software extended with the Rapid UML solution from the Software Development area of ConceptDraw Solution Park.
Examples of computer applications that use the client–server model are Email, network printing, and the World Wide Web." [Client–server model. Wikipedia]
The UML communication diagram example "Client server access" was created using the ConceptDraw PRO diagramming and vector drawing software extended with the Rapid UML solution from the Software Development area of ConceptDraw Solution Park.
UML communication diagram
 Idea Communication
This solution extends ConceptDraw MINDMAP software by allowing everyone in a company to use generic symbols on maps and documents.
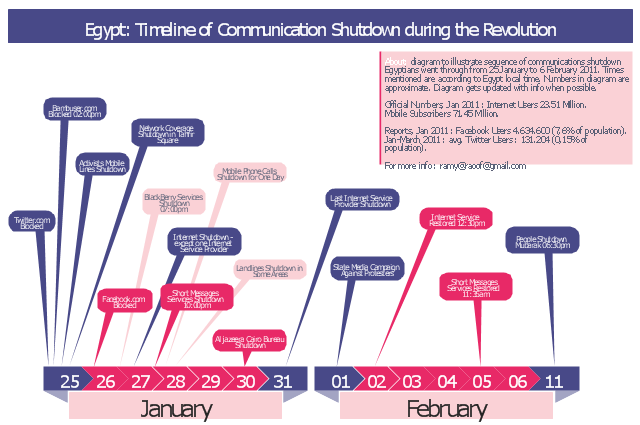
This typography infographics example was redesigned from the Wikimedia Commons file: Egypt timeline of communication shutdown during jan25revolution.jpg. [commons.wikimedia.org/ wiki/ File:Egypt_ timeline_ of_ communication_ shutdown_ during_ jan25revolution.jpg]
This file is licensed under the Creative Commons Attribution 3.0 Unported license. [creativecommons.org/ licenses/ by/ 3.0/ deed.en]
Diagram to illustrate sequence of communications shutdown Egyptians went through from 25 January to 06 February 2011. Times mentioned are according to Egypt local time. Numbers in the diagram are approximate. Last update of the diagram October 2011.
"2011 Internet shutdown.
Diagram to illustrate sequence of communications shutdown Egyptians went through from 25 January to 06 February 2011. Times mentioned are according to Egypt local time. Numbers in the diagram are approximate. Last update of the diagram October 2011.
The 2011 Egyptian protests began on 25 January 2011. As a result, on January 25 and 26, the government blocked Twitter in Egypt and later Facebook was blocked as well.
On January 27, various reports claimed that access to the Internet in the entire country had been shut down. ...
On February 2, connectivity was re-established by the four main Egyptian service providers. A week later, the heavy filtering that occurred at the height of the revolution had ended and bloggers and online activists who had been arrested were released." [Internet in Egypt. Wikipedia]
The example "Egypt timeline of communication shutdown during jan 25 revolution" was created using the ConceptDraw PRO diagramming and vector drawing software extended with the Typography Infographics solition from the area "What is infographics" in ConceptDraw Solution Park.
Infographics
 Telecommunication Network Diagrams
Telecommunication Network Diagrams solution extends ConceptDraw PRO software with samples, templates, and great collection of vector stencils to help the specialists in a field of networks and telecommunications, as well as other users to create Computer systems networking and Telecommunication network diagrams for various fields, to organize the work of call centers, to design the GPRS networks and GPS navigational systems, mobile, satellite and hybrid communication networks, to construct the mobile TV networks and wireless broadband networks.
- Flowchart Of Communication Components
- Communication network diagram | Telecommunication Network ...
- Diagramming Software for Design UML Communication Diagrams ...
- Mobile satellite communication network diagram ...
- Uml Communication Diagram
- Mobile satellite communication network diagram | Communication ...
- Satellite telecom network diagram | Mobile satellite communication ...
- Design elements - Bank UML communication diagram | Design ...
- Communication medium diagram | How to Collaborate in Business ...
- Wide area network (WAN) topology. Computer and Network Examples
- Flowchart For Wireless Communication
- Communication medium diagram
- UML communication diagram - Client server access | Gestures ...
- Communication network diagram
- Communication Diagram UML2.0 / Collaboration UML1.x ...
- Communication Network Diagram
- Communication network diagram | Cisco Network Topology. Cisco ...
- Network Communication Diagram
- UML package diagram - Template | UML communication diagram ...