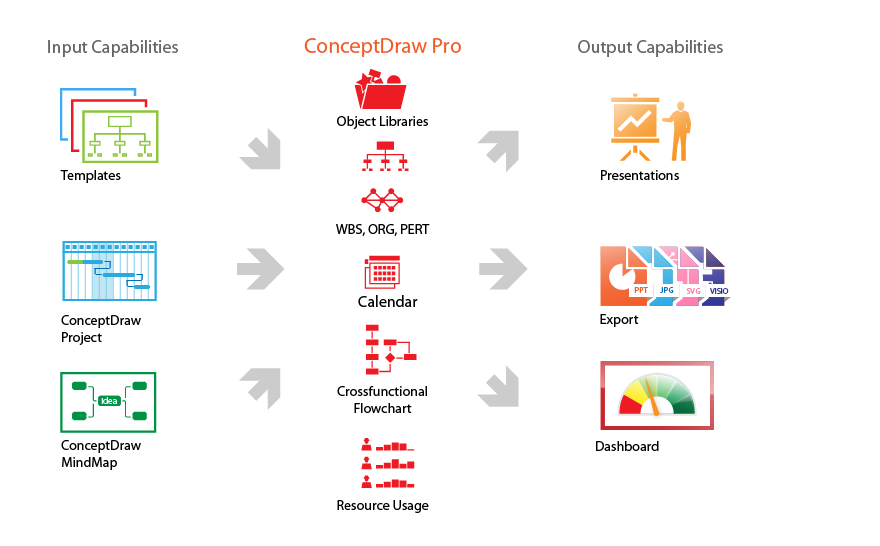
Product Overview
ConceptDraw DIAGRAM offers a wide choice of powerful and easy-to-use tools for quickly creating all kinds of charts and diagrams. Even if you've never used a drawing tool before, it's very easy to create high-quality professional graphic documents with ConceptDraw DIAGRAM.HelpDesk
How to Design a Food-related Infographics
Today a large piece of business is referred to food. This business cannot be imagined without various kinds of visualizations. You can see them everywhere — on brand logos, in advertising, on menus, and in flyers. Also, different food-related infographics are used to promote healthy nutrition and to deliver information on how to maintain an effective diet. ConceptDraw Cooking Recipes solution offers a great collection of bright food-related images and icons, placed into themed libraries. It can be used for catering menu graphics, on marketing flyers, or as a concomitant text for infographics.Business diagrams & Org Charts with ConceptDraw DIAGRAM
Business flowcharting tool helps you create a flowchart with minimal effort. With ConceptDraw you can make a flowchart, draw data flow diagrams, orgchart professional, process flow diagrams etc - without any prior knowledge or training.HelpDesk
How to Draw a Map of North America
Geographic maps, cardiograms, and thematic maps are often used for geographical visualization of business information. Any country can inspire a wealth of geopolitical statistical data. A common way of assimilating this data is to create maps that convey a particular theme or subject matter in relation to a specific geographical area. Known as thematic maps, they cover themes such as population density, average rainfall, or political allegiance, differentiating the data by using graphical elements and annotation. Thematic maps contrast general reference maps, which tend to display information on a variety of subjects — vegetation, topology, roads, and highways, for example. A thematic map will always focus on one particular subject matter. ConceptDraw DIAGRAM can be helpful as a tool for creating maps of countries and regions of the world. It allows you to draw continental maps quickly and easily using the special templates and vector stencils libraries.
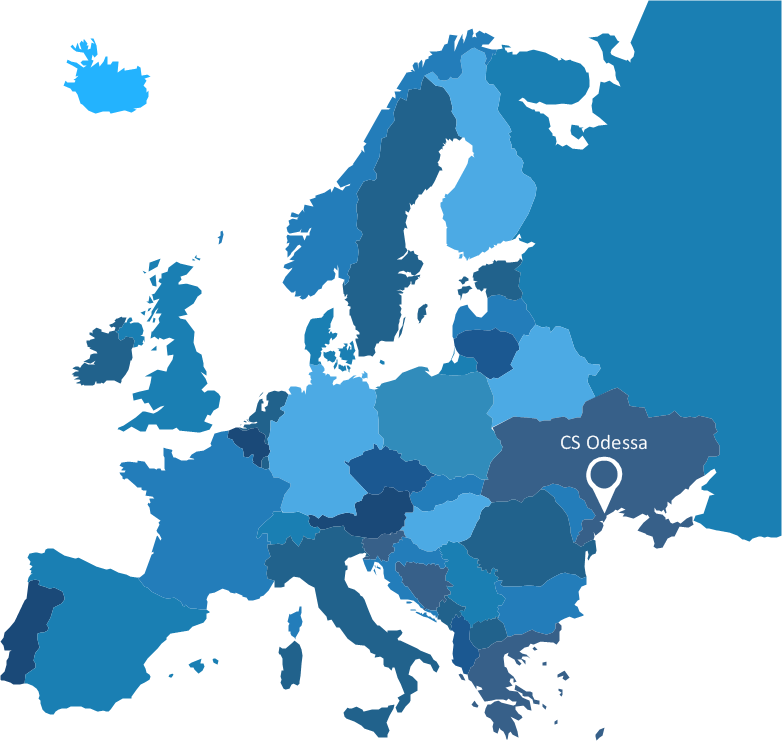
Visualization Spatial Data Using Thematic Maps Combined with Infographics
Now anyone can build an infographics from their data using ConceptDraw.Nice and simple, but the features it have are power-packed!
- How to Draw a Map of North America Using ConceptDraw PRO ...
- How to Create a Map of Germany Using ConceptDraw PRO ...
- How to Draw a Geographical Map Quickly
- How to Draw Maps of Australia Using ConceptDraw PRO | Spatial ...
- Metropolitan area networks (MAN). Computer and Network Examples
- How to Draw Maps of Australia Using ConceptDraw PRO | Germany ...
- Network Diagramming with ConceptDraw PRO | Network Layout ...
- Geo Map - South America Continent | How to Draw a Map of North ...
- Interior Design School Layout - Design Elements | How to Design a ...
- How To Create the Interaction (Relation) Diagram | ConceptDraw ...
- Geo Map - Europe - United Kingdom
- How to draw Metro Map style infographics? Moscow, New York, Los ...
- Geo Map - USA - Ohio | Geo Map - South America - Mexico | Geo ...
- How To Draw Building Plans | Fire Exit Plan. Building Plan ...
- Winter Sports. Illustrations and Visualize Statistics | Spatial ...
- UK Map | How to Create a Map Depicting the United Kingdom ...
- Mechanical Engineering | Process Flowchart | How to Draw a ...
- The Information Systems That Serve Each Of The Three Levels Of
- 4 Level pyramid model diagram - Information systems types ...
- Four Levels Of Information System
- ERD | Entity Relationship Diagrams, ERD Software for Mac and Win
- Flowchart | Basic Flowchart Symbols and Meaning
- Flowchart | Flowchart Design - Symbols, Shapes, Stencils and Icons
- Flowchart | Flow Chart Symbols
- Electrical | Electrical Drawing - Wiring and Circuits Schematics
- Flowchart | Common Flowchart Symbols