The vector stencils library "Meter indicators" contains 29 Live Objects: speedometer gauge, dial, bullet, slider and level meter visual indicators.
The Live Objects designed to display actual measures of performance metrics from external data source files. Some of them also display comparative measures, and colored zones of qualitative ranges with legend.
Use this library to create visual dashboards in the ConceptDraw PRO diagramming and vector drawing software extended with the Meter Dashboard solution from the area "What is a Dashboard" of ConceptDraw Solution Park.
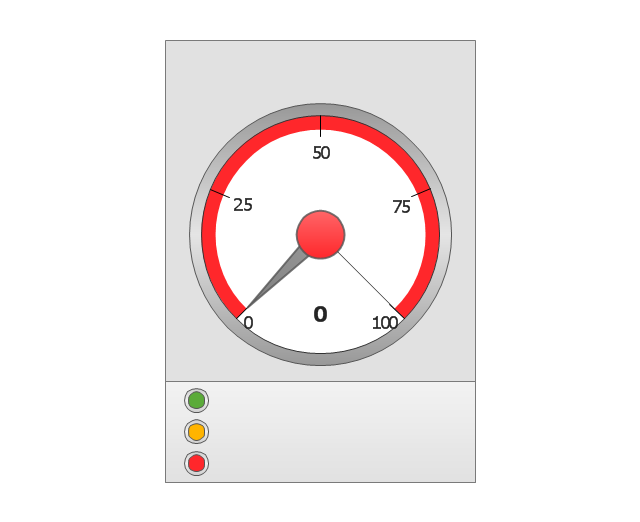
Speedometer Gauge 1
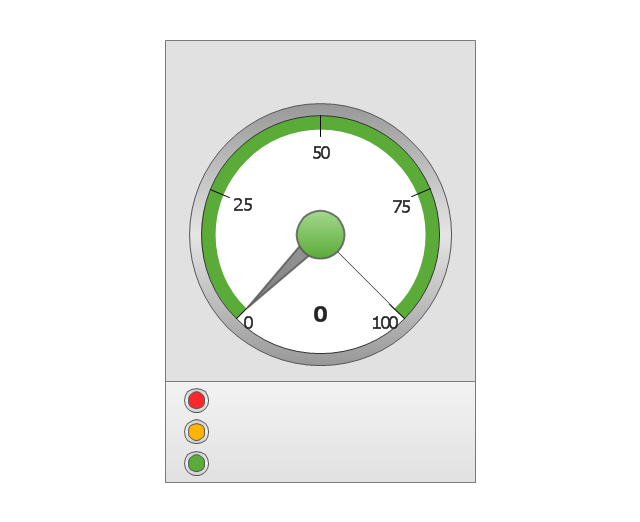
Speedometer Gauge 2
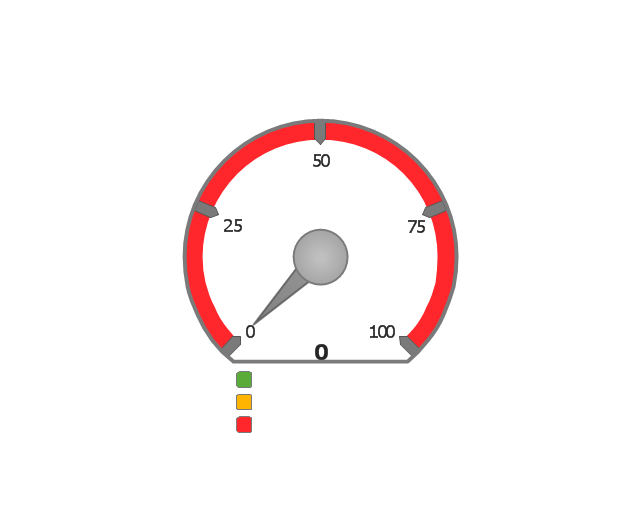
Speedometer Gauge 3
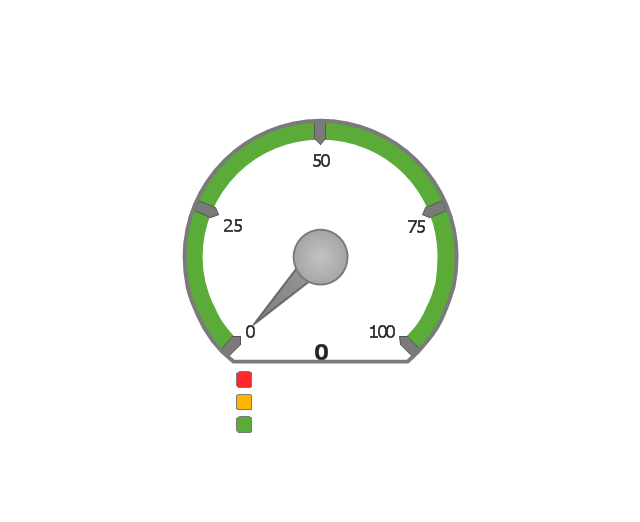
Speedometer Gauge 4
Dial 1
Dial 2
Bullet 1
Bullet 2

Bullet 3

Bullet 4
Bullet 5

Bullet 6

Directed Bullet 1
Directed Bullet 2

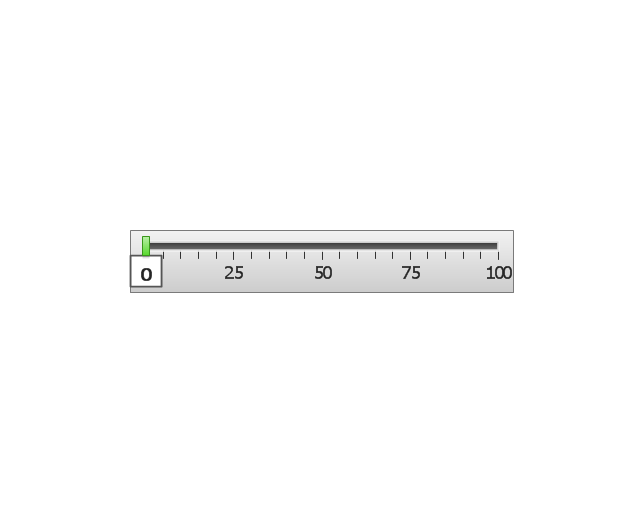
Slider Horizontal 1
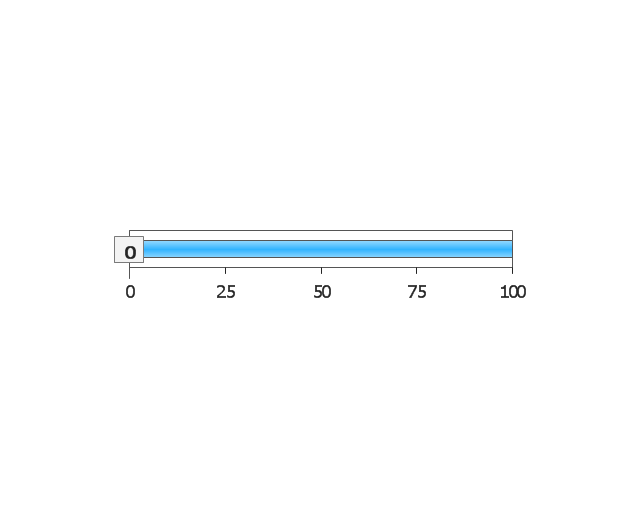
Slider Horizontal 2
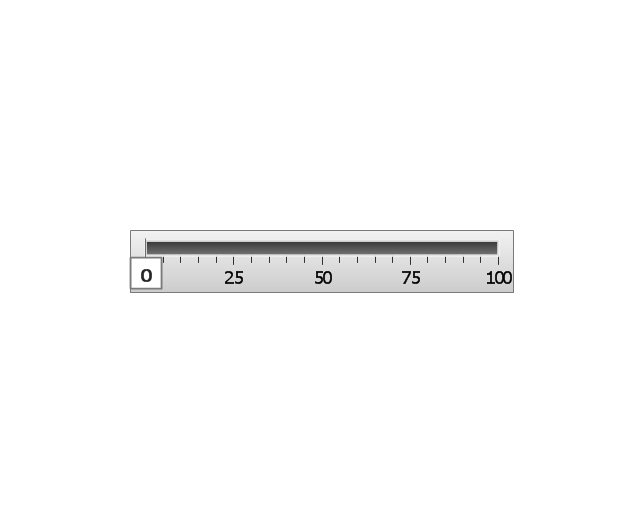
Slider Horizontal 3
Slider Horizontal 4
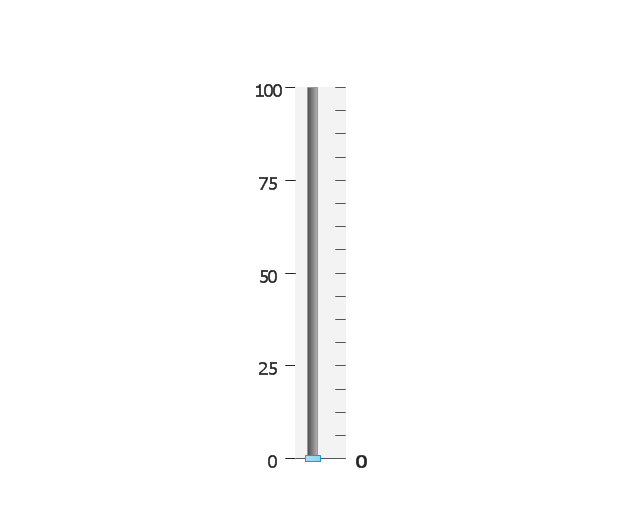
Slider Vertical 1
Slider Vertical 2
Slider Horizontal 5
Slider Horizontal 6
Slider Horizontal 7
Slider Vertical 3
Level Meter 1
Level Meter 2
Level Meter 3

Level Meter 4
Level Meter 5
 Meter Dashboard
Meter dashboard solution extends ConceptDraw DIAGRAM software with templates, samples and vector stencils library with meter indicators for drawing visual dashboards showing quantitative data.
The vector stencils library "Meter indicators" contains 29 Live Objects: speedometer gauge, dial, bullet, slider and level meter visual indicators.
The Live Objects designed to display actual measures of performance metrics from external data source files. Some of them also display comparative measures, and colored zones of qualitative ranges with legend.
Use this library to create visual dashboards in the ConceptDraw PRO diagramming and vector drawing software extended with the Meter Dashboard solution from the area "What is a Dashboard" of ConceptDraw Solution Park.
The Live Objects designed to display actual measures of performance metrics from external data source files. Some of them also display comparative measures, and colored zones of qualitative ranges with legend.
Use this library to create visual dashboards in the ConceptDraw PRO diagramming and vector drawing software extended with the Meter Dashboard solution from the area "What is a Dashboard" of ConceptDraw Solution Park.
Speedometer Gauge 1
Speedometer Gauge 2
Speedometer Gauge 3
Speedometer Gauge 4
Dial 1
Dial 2
Bullet 1
Bullet 2
Bullet 3
Bullet 4
Bullet 5
Bullet 6
Directed Bullet 1
Directed Bullet 2
Slider Horizontal 1
Slider Horizontal 2
Slider Horizontal 3
Slider Horizontal 4
Slider Vertical 1
Slider Vertical 2
Slider Horizontal 5
Slider Horizontal 6
Slider Horizontal 7
Slider Vertical 3
Level Meter 1
Level Meter 2
Level Meter 3
Level Meter 4
Level Meter 5
 Cross-Functional Flowcharts
Cross-functional flowcharts are powerful and useful tool for visualizing and analyzing complex business processes which requires involvement of multiple people, teams or even departments. They let clearly represent a sequence of the process steps, the order of operations, relationships between processes and responsible functional units (such as departments or positions).
 HR Flowcharts
Human resource management diagrams show recruitment models, the hiring process and human resource development of human resources.
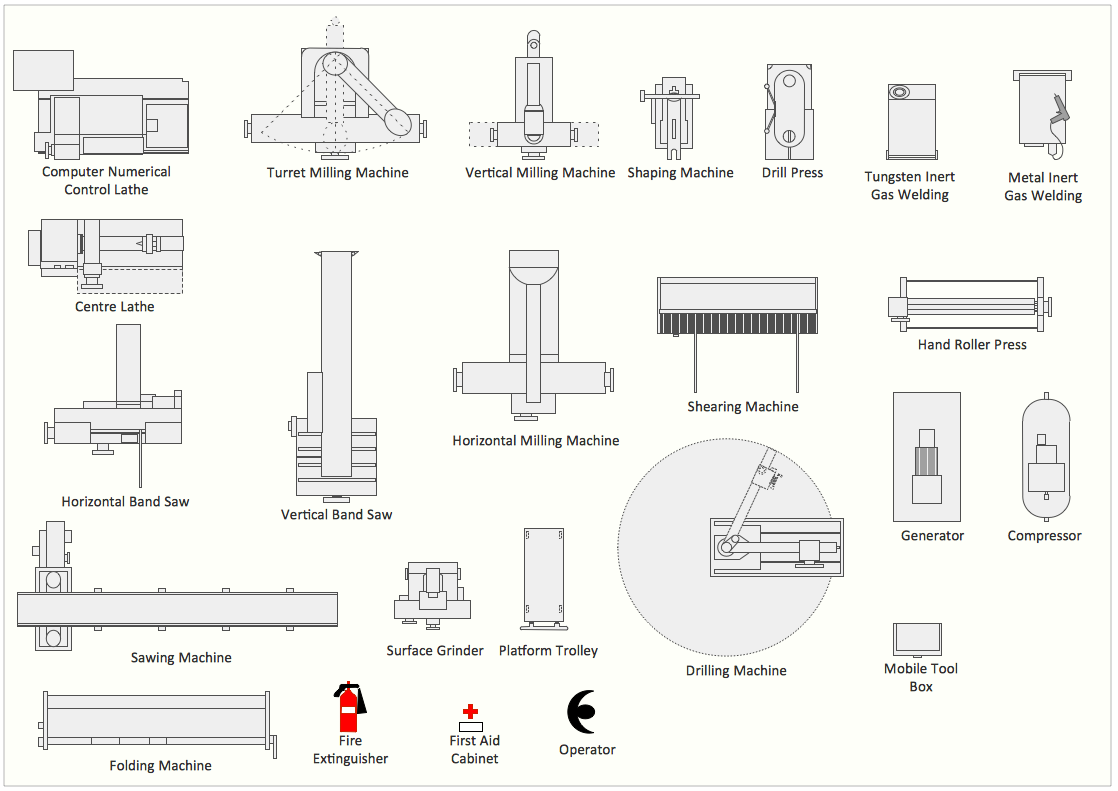
Interior Design Machines and Equipment - Design Elements
 Picture Graphs
Typically, a Picture Graph has very broad usage. They many times used successfully in marketing, management, and manufacturing. The Picture Graphs Solution extends the capabilities of ConceptDraw DIAGRAM with templates, samples, and a library of professionally developed vector stencils for designing Picture Graphs.
Ice Hockey Rink Dimensions

Competitor Analysis

 Bar Graphs
The Bar Graphs solution enhances ConceptDraw DIAGRAM functionality with templates, numerous professional-looking samples, and a library of vector stencils for drawing different types of Bar Graphs, such as Simple Bar Graph, Double Bar Graph, Divided Bar Graph, Horizontal Bar Graph, Vertical Bar Graph, and Column Bar Chart.
- Horizontal Vector Png
- Vector Line Png
- Line Separator Png
- Meter indicators 2 - Vector stencils library | Sales dashboard - Vector ...
- Football Field Png
- Architectural North Sign Png Image
- Blue Radio Button
- Soccer (Football) Dimensions | Design a Soccer (Football) Field ...
- Loading Png
- Meter indicators 2 - Vector stencils library | Sales dashboard - Vector ...