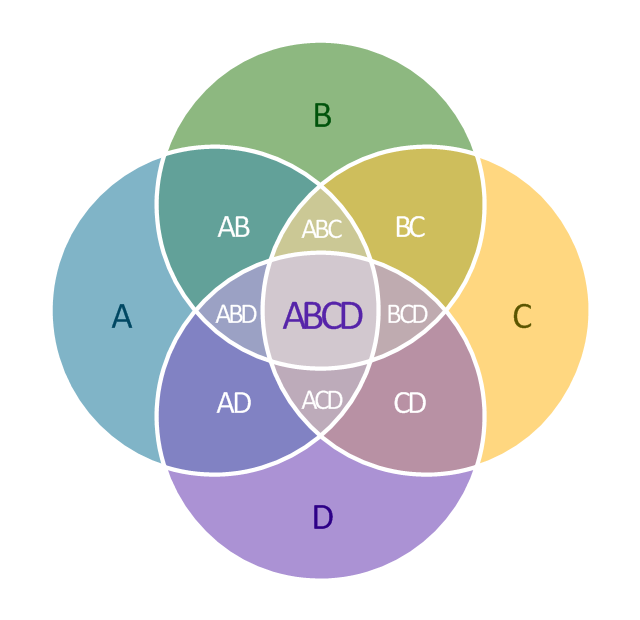
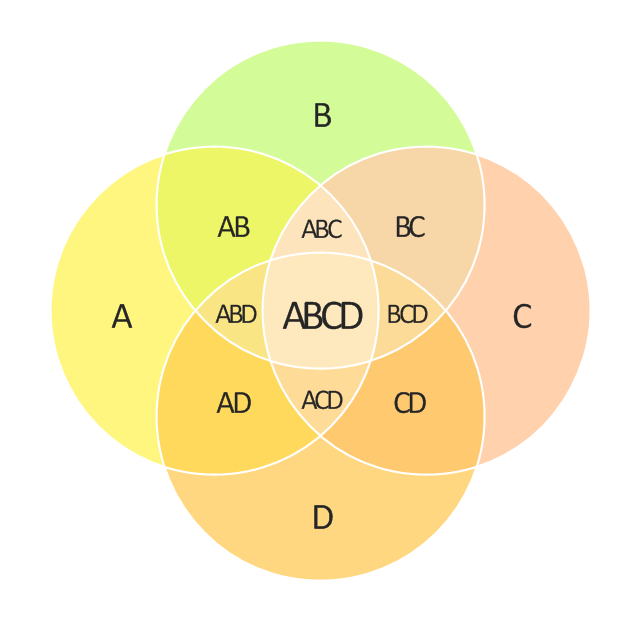
Use this template to design your four set Venn diagrams.
In maths logic Venn diagram is "a diagram in which mathematical sets or terms of a categorial statement are represented by overlapping circles within a boundary representing the universal set, so that all possible combinations of the relevant properties are represented by the various distinct areas in the diagram". [thefreedictionary.com/ Venn+diagram]
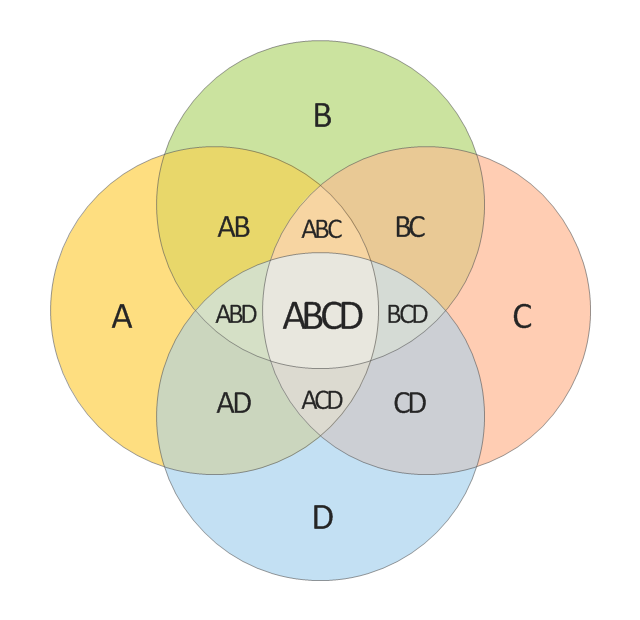
The template "4-set Venn diagram" for the ConceptDraw PRO diagramming and vector drawing software is included in the Venn Diagrams solution from the area "What is a Diagram" of ConceptDraw Solution Park.
In maths logic Venn diagram is "a diagram in which mathematical sets or terms of a categorial statement are represented by overlapping circles within a boundary representing the universal set, so that all possible combinations of the relevant properties are represented by the various distinct areas in the diagram". [thefreedictionary.com/ Venn+diagram]
The template "4-set Venn diagram" for the ConceptDraw PRO diagramming and vector drawing software is included in the Venn Diagrams solution from the area "What is a Diagram" of ConceptDraw Solution Park.
Template

The vector stencils library "Venn diagrams" contains 12 templates of Venn and Euler diagrams.
Use these shapes to draw your Venn and Euler diagrams in the ConceptDraw PRO diagramming and vector drawing software extended with the Venn Diagrams solution from the area "What is a Diagram" of ConceptDraw Solution Park.
Use these shapes to draw your Venn and Euler diagrams in the ConceptDraw PRO diagramming and vector drawing software extended with the Venn Diagrams solution from the area "What is a Diagram" of ConceptDraw Solution Park.
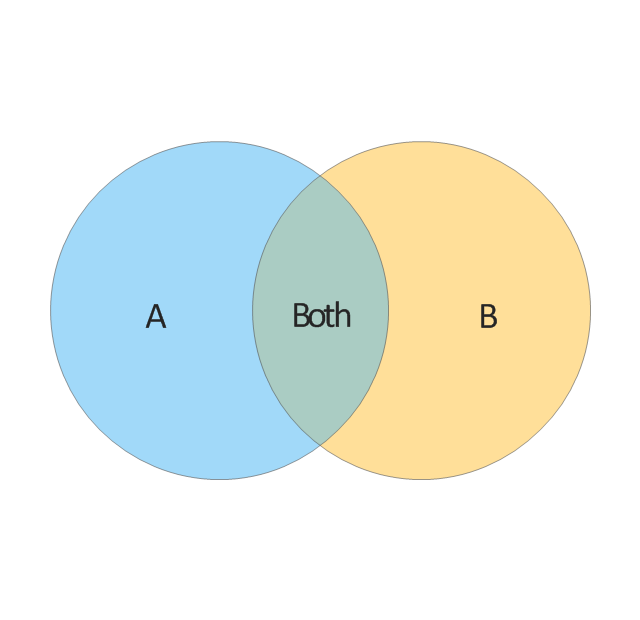
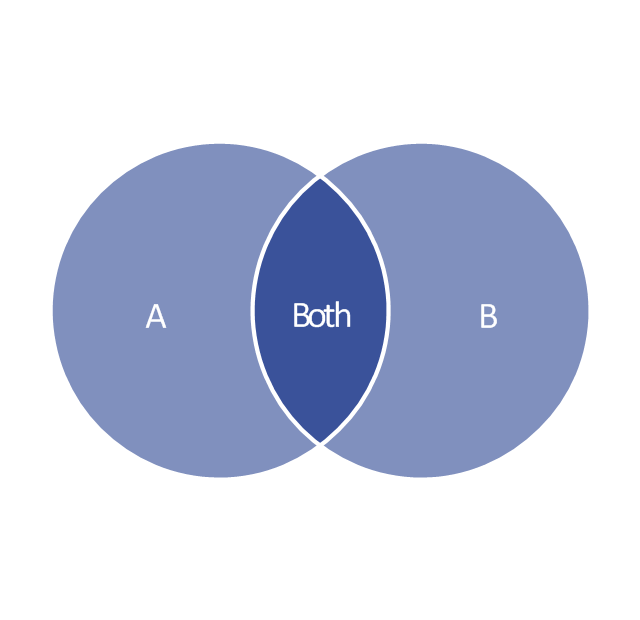
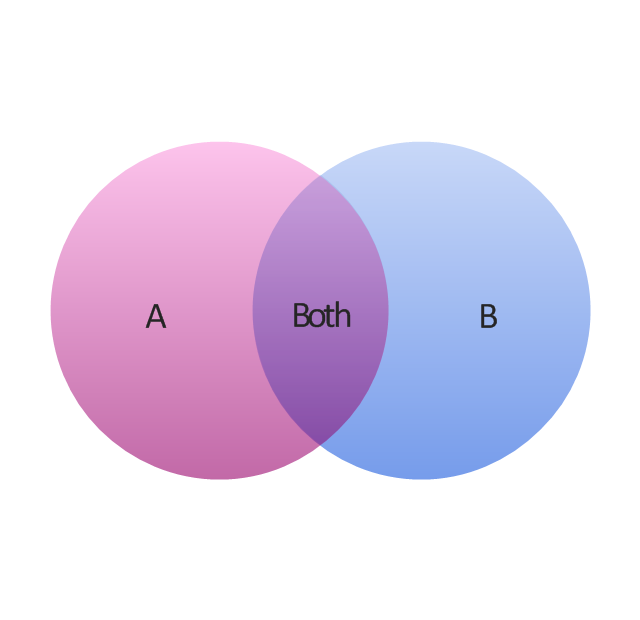
2-set Venn diagram
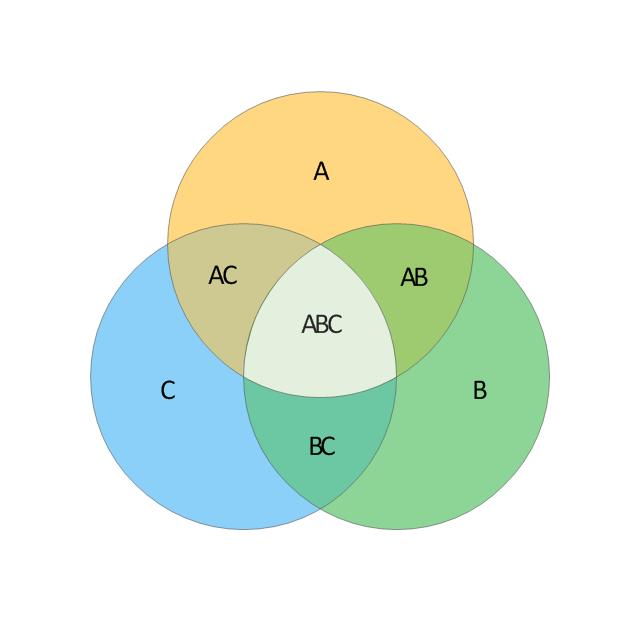
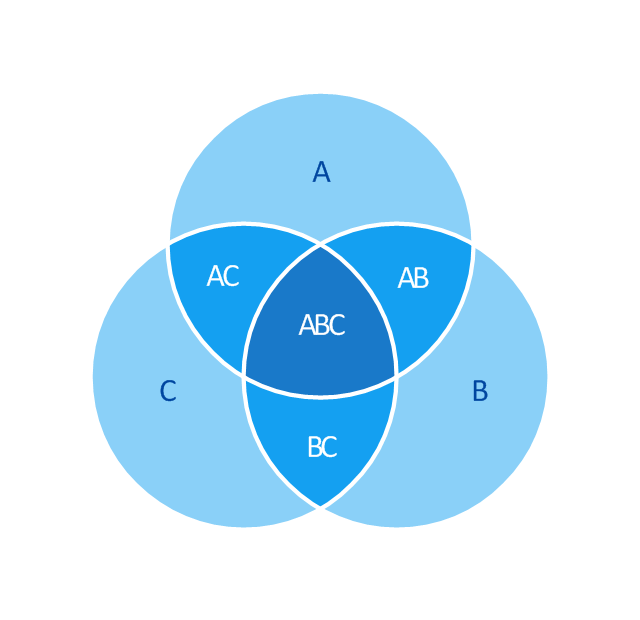
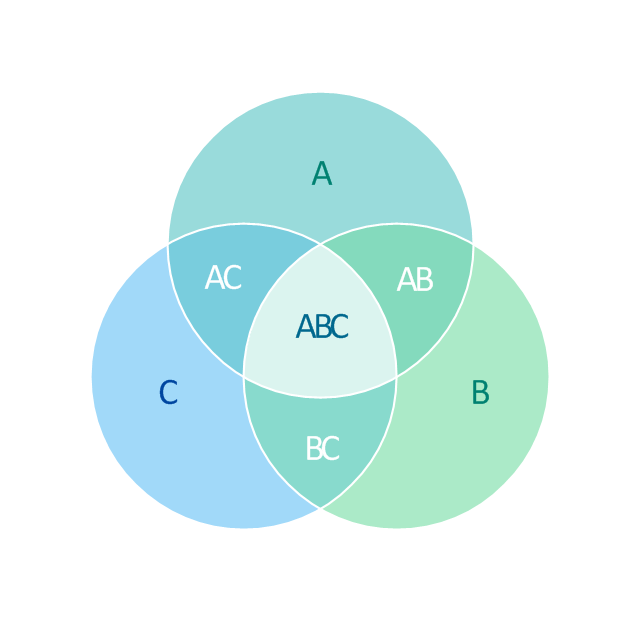
3-set Venn diagram
4-set Venn diagram
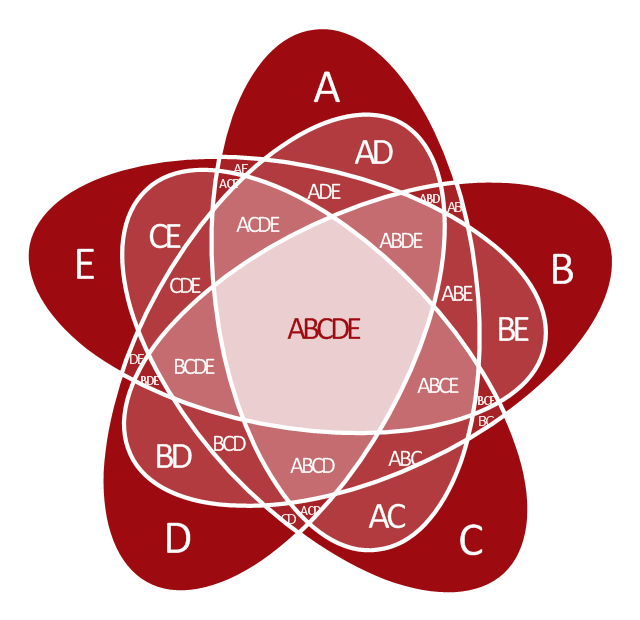
5-set Venn diagram

2-set Venn diagram
3-set Venn diagram
4-set Venn diagram
5-set Venn diagram
2-set Venn diagram
3-set Venn diagram
4-set Venn diagram
5-set Venn diagram

 Venn Diagrams
Venn Diagrams are actively used to illustrate simple set relationships in set theory and probability theory, logic and statistics, mathematics and computer science, linguistics, sociology, and marketing. Venn Diagrams are also often used to visually summarize the status and future viability of a project.
HelpDesk
How to Create a Venn Diagram in ConceptDraw PRO

- Venn Diagrams | Venn Diagram Examples for Problem Solving ...
- 4 - Set Venn diagram - Template | Venn Diagram | Venn Diagram ...
- 4 - Set Venn diagram - Template | Venn diagrams - Vector stencils ...
- Venn Diagram For 4 Sets
- 4 - Set Venn diagram - Template
- 4 - Set Venn diagram - Template
- 4 - Set Venn diagram - Template | Venn diagrams - Vector stencils ...
- 4 - Set Venn diagram - Template | 3 Circle Venn. Venn Diagram ...
- 4 Venn Diagram Generator
- 4 - Set Venn diagram - Template | Pyramid Diagram | Venn Diagram ...
- 4 Circle Venn Diagram Template
- 5- Set Venn diagram - Template | 4 - Set Venn diagram - Template ...
- 5- Set Venn diagram - Template | 2- Set Venn diagram - Template | 4 ...
- Venn Diagram Template
- Venn Diagram Maker | Flow Chart Creator | 4 - Set Venn diagram ...
- 3 Set Venn Diagram
- Venn Diagram With 4 Circles Template
- Venn Diagrams | 4 - Set Venn diagram - Template | Venn Diagram ...
- 5- Set Venn diagram - Template | Venn diagrams - Vector stencils ...
- Four Circle Venn Diagram Problems