 Entity-Relationship Diagram (ERD)
Entity-Relationship Diagram (ERD) solution extends ConceptDraw DIAGRAM software with templates, samples and libraries of vector stencils from drawing the ER-diagrams by Chen's and crow’s foot notations.
 Value Stream Mapping
Value stream mapping solution extends ConceptDraw DIAGRAM software with templates, samples and vector stencils for drawing the Value Stream Maps (VSM) in lean manufacturing practice.
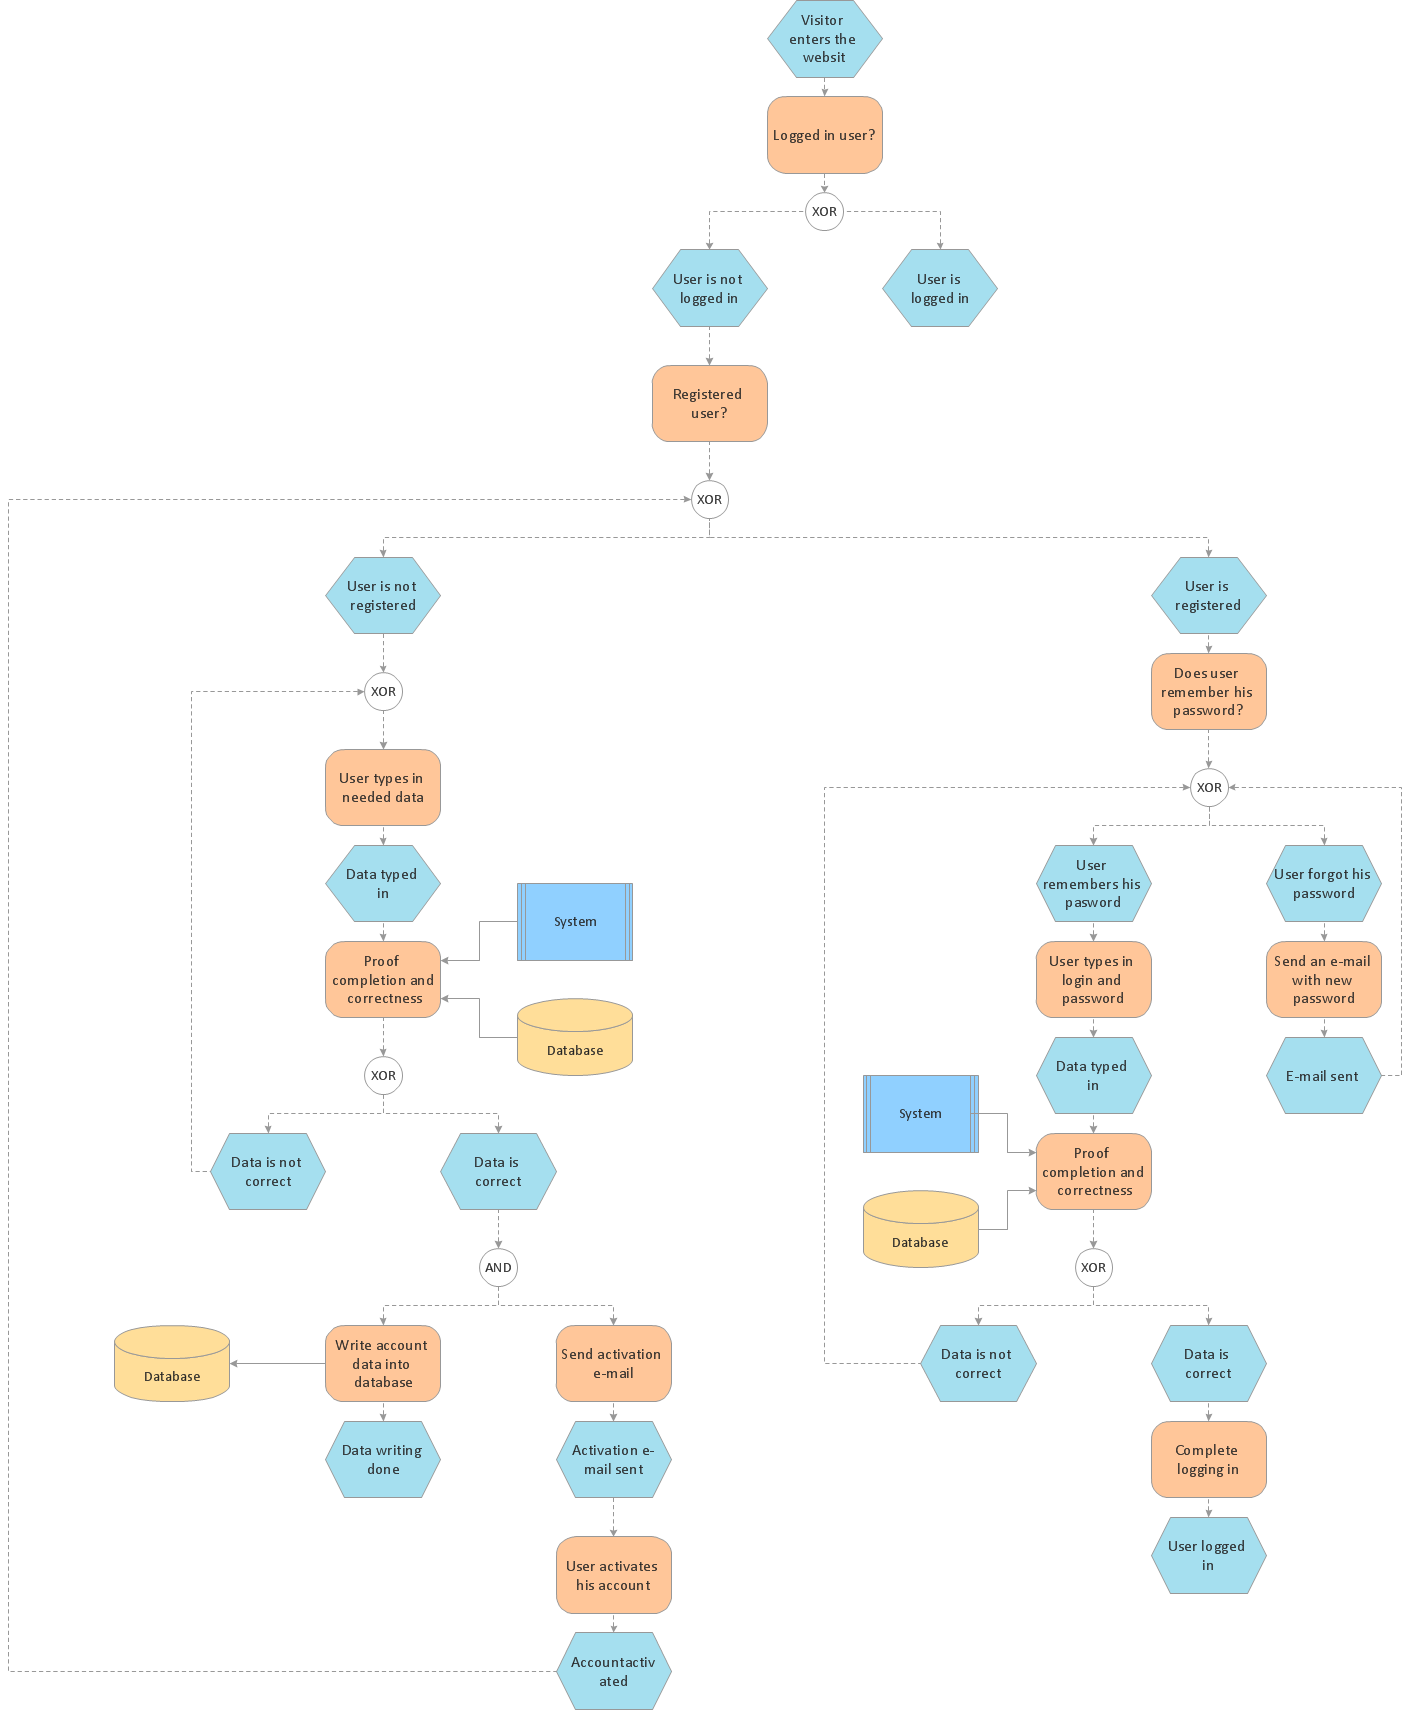
 Event-driven Process Chain Diagrams
Event-Driven Process Chain Diagrams solution extends ConceptDraw DIAGRAM functionality with event driven process chain templates, samples of EPC engineering and modeling the business processes, and a vector shape library for drawing the EPC diagrams and EPC flowcharts of any complexity. It is one of EPC IT solutions that assist the marketing experts, business specialists, engineers, educators and researchers in resources planning and improving the business processes using the EPC flowchart or EPC diagram. Use the EPC solutions tools to construct the chain of events and functions, to illustrate the structure of a business process control flow, to describe people and tasks for execution the business processes, to identify the inefficient businesses processes and measures required to make them efficient.
 Crystal Mapping
With Crystal Mapping all goals and relevant information can be observed in one radiant dashboard.
 Cross-Functional Flowcharts
Cross-functional flowcharts are powerful and useful tool for visualizing and analyzing complex business processes which requires involvement of multiple people, teams or even departments. They let clearly represent a sequence of the process steps, the order of operations, relationships between processes and responsible functional units (such as departments or positions).
 Correlation Dashboard
Correlation dashboard solution extends ConceptDraw DIAGRAM software with samples, templates and vector stencils library with Scatter Plot Charts for drawing the visual dashboard visualizing data correlation.
How to Create a Social Media DFD Flowchart

How to Help Customers be More Productive
- Conceptdraw .com: Mind Map Software, Drawing Tools | Project ...
- UML Class Diagram Tutorial | How to draw Metro Map style ...
- ConceptDraw PRO Compatibility with MS Visio | Network ...
- How To use Office Layout Software | ConceptDraw Solution Park ...
- UML Diagrams with ConceptDraw PRO | UML Class Diagrams ...
- ConceptDraw PRO Compatibility with MS Visio | Visio Files and ...
- UML Class Diagram Tutorial | Rapid UML | Rapid UML |
- UML Class Diagram Tutorial
- ConceptDraw PRO Compatibility with MS Visio | Visio Files and ...
- Visualizing a FileMaker database with ConceptDraw PRO | Pyramid ...
- Network Diagram Examples | Network Diagram Software | 3D ...
- How To Plan and Implement Projects Faster | Looking at ...
- ConceptDraw PRO Network Diagram Tool
- Building Drawing Software for Design Office Layout Plan | How To ...
- ConceptDraw Solution Park | Entity-Relationship Diagram (ERD ...
- Organizational Charts with ConceptDraw PRO
- How to Draw an Organization Chart | ConceptDraw PRO ...
- UML Diagrams with ConceptDraw PRO | UML Class Diagrams ...
- Data Flow Diagrams | ER Diagrams with ConceptDraw PRO ...
- ConceptDraw Arrows10 Technology | How to Dramatically Reduce ...