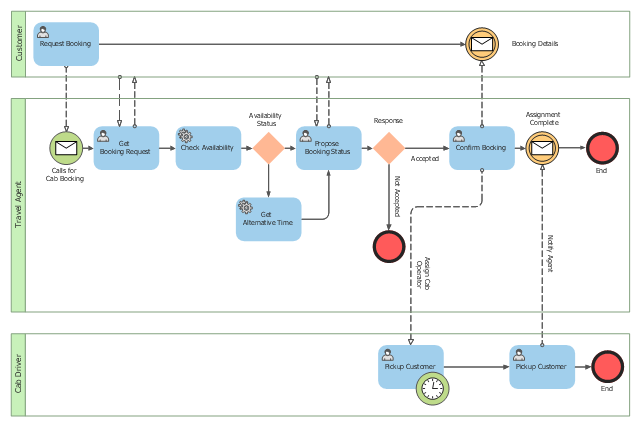
This BPMN (Business Process Model and Notation) collaboration diagram sample depicts interactions between customer, travel agent and cab driver, which are defined as a sequence of activities, and represent the message exchange during a cab booking process.
"Business process modeling is used to communicate a wide variety of information to a wide variety of audiences. BPMN is designed to cover this wide range of usage and allows modeling of end-to-end business processes to allow the viewer of the Diagram to be able to easily differentiate between sections of a BPMN Diagram. There are three basic types of sub-models within an end-to-end BPMN model: Private (internal) business processes, Abstract (public) processes, and Collaboration (global) processes...
Collaboration (global) processes.
A collaboration process depicts the interactions between two or more business entities. These interactions are defined as a sequence of activities that represent the message exchange patterns between the entities involved. Collaboration processes may be contained within a Pool and the different participant business interactions are shown as Lanes within the Pool. In this situation, each Lane would represent two participants and a direction of travel between them. They may also be shown as two or more Abstract Processes interacting through Message Flow. These processes can be modeled separately or within a larger BPMN Diagram to show the Associations between the collaboration process activities and other entities. If the collaboration process is in the same Diagram as one of its corresponding private business process, then the activities that are common to both processes can be associated." [Business Process Model and Notation. Wikipedia]
The business process modeling diagram example "Cab booking public process - Collaboration BPMN 2.0 diagram" was designed using the ConceptDraw PRO diagramming and vector drawing software extended with the Business Process Diagram solution from the Business Processes area of ConceptDraw Solution Park.
Business process modeling
Design Pictorial Infographics. Design Infographics

This circle pie chart sample was created on the base of the figure illustrating the article "Impacts of Parking Strategies" from the Chicago Metropolitan Agency for Planning website. "Todd Litman's "Cycle of Automobile Dependency" shows how auto-centric land use planning and excessive parking supply have created this situation. Parking management strategies can be used to break this cycle, by changing development patterns and improving travel options (2006)." [cmap.illinois.gov/ about/ 2040/ supporting-materials/ process-archive/ strategy-papers/ parking/ impacts-of-parking-strategies]
The circle pie chart example "Cycle of automobile dependency" was created using the ConceptDraw PRO diagramming and vector drawing software extended with the Target and Circular Diagrams solution from the Marketing area of ConceptDraw Solution Park.
www.conceptdraw.com/ solution-park/ marketing-target-and-circular-diagrams
Circle pie chart

How To Create a Workflow Diagram
Workflow Diagram

- Data Flow Diagram Of Sales For Travel Agency
- Traveling Agency Dfd Diagram
- UML Collaboration Diagram (UML2.0) | Diagramming Software for ...
- Conceptdraw For Travel Agencies
- Draw A Data Flow Diagram Level 1 Of Travel Agent Booking System
- Cab booking public process - Collaboration BPMN 2.0 diagram ...
- Business Process Model and Notation | How to Create a Business ...
- Business process diagram BPMN 1.2 - Hiring process | How to ...
- Data Flow Diagram Of Travel Management System
- BPMN 2.0 | Trouble ticket system - BPMN 2.0 diagram | Design ...
- Flow Diagram Of Booking Process
- Business process diagram BPMN 1.2 - Hiring process | Cab booking ...
- Cab booking public process - Collaboration BPMN 2.0 diagram
- BPMN 2.0 | Logistics - Choreography BPMN 2.0 diagram | Cab ...
- Types of Flowcharts | SWOT and TOWS Matrix Diagrams | Azure ...
- Cab booking public process - Collaboration BPMN 2.0 diagram | PM ...
- Draw The Collaboration Diagram For Tourist Company
- Taxi Service Data Flow Diagram DFD Example | Workflow Diagram ...
- BPMN 2.0 | Business Process Diagrams | Business Process ...
- BPMN 2.0 | Business Process Model and Notation | Cab booking ...