HelpDesk
How to Create a Timeline Diagram in ConceptDraw PRO

 ConceptDraw Solution Park
ConceptDraw Solution Park collects graphic extensions, examples and learning materials
 Timeline Diagrams
Timeline Diagrams solution extends ConceptDraw PRO diagramming software with samples, templates and libraries of specially developed smart vector design elements of timeline bars, time intervals, milestones, events, today marker, legend, and many other elements with custom properties, helpful for professional drawing clear and intuitive Timeline Diagrams. Use it to design simple Timeline Diagrams and designate only the main project stages, or highly detailed Timeline Diagrams depicting all project tasks, subtasks, milestones, deadlines, responsible persons and other description information, ideal for applying in presentations, reports, education materials, and other documentation.
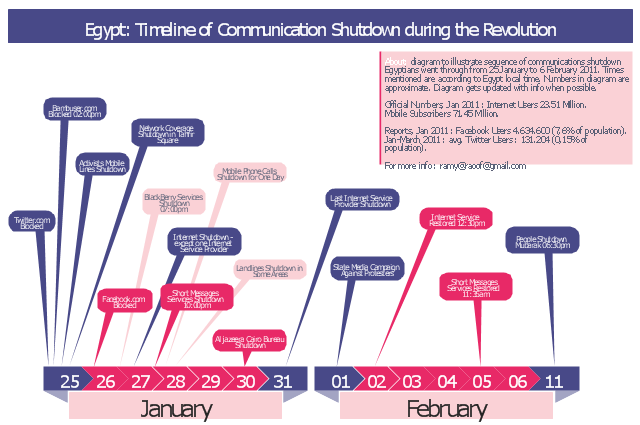
This typography infographics example was redesigned from the Wikimedia Commons file: Egypt timeline of communication shutdown during jan25revolution.jpg. [commons.wikimedia.org/ wiki/ File:Egypt_ timeline_ of_ communication_ shutdown_ during_ jan25revolution.jpg]
This file is licensed under the Creative Commons Attribution 3.0 Unported license. [creativecommons.org/ licenses/ by/ 3.0/ deed.en]
Diagram to illustrate sequence of communications shutdown Egyptians went through from 25 January to 06 February 2011. Times mentioned are according to Egypt local time. Numbers in the diagram are approximate. Last update of the diagram October 2011.
"2011 Internet shutdown.
Diagram to illustrate sequence of communications shutdown Egyptians went through from 25 January to 06 February 2011. Times mentioned are according to Egypt local time. Numbers in the diagram are approximate. Last update of the diagram October 2011.
The 2011 Egyptian protests began on 25 January 2011. As a result, on January 25 and 26, the government blocked Twitter in Egypt and later Facebook was blocked as well.
On January 27, various reports claimed that access to the Internet in the entire country had been shut down. ...
On February 2, connectivity was re-established by the four main Egyptian service providers. A week later, the heavy filtering that occurred at the height of the revolution had ended and bloggers and online activists who had been arrested were released." [Internet in Egypt. Wikipedia]
The example "Egypt timeline of communication shutdown during jan 25 revolution" was created using the ConceptDraw PRO diagramming and vector drawing software extended with the Typography Infographics solition from the area "What is infographics" in ConceptDraw Solution Park.
Infographics
HelpDesk
What Information to be Displayed in the ConceptDraw PROJECT Gantt Chart View


HelpDesk
How to Shift Dates in ConceptDraw PROJECT

ConceptDraw Solution Park
ConceptDraw Solution Park collects graphic extensions, examples and learning materials
 Business Processes
Business Process solution extends ConceptDraw PRO software with business process diagrams as cross-functional flowcharts, workflows, process charts, IDEF0, timelines, calendars, Gantt charts, business process modeling, audit and opportunity flowcharts.
 Computer and Networks Area
The solutions from Computer and Networks Area of ConceptDraw Solution Park collect samples, templates and vector stencils libraries for drawing computer and network diagrams, schemes and technical drawings.
 Quality
This solution extends ConceptDraw PRO v9 and ConceptDraw MINDMAP v7 with Quality Management Diagrams (Total Quality Management Diagrams, Timelines, Workflows, Value Stream Maps) and Mind Maps (Presentations, Meeting Agendas, Problem to be solved).
 Marketing
This solution extends ConceptDraw PRO v9 and ConceptDraw MINDMAP v7 with Marketing Diagrams and Mind Maps (brainstorming, preparing and holding meetings and presentations, sales calls).
- Online Diagram Tool | Online Flow Chart | How to Create a Timeline ...
- Flow Chart Online | How to Create a Timeline Diagram in ...
- Flow Chart Online | Online Flow Chart | How to Create a Timeline ...
- Flow Chart Online | Online Diagram Tool | How to Create a Timeline ...
- Online Diagram Tool | How to Create a Timeline Diagram in ...
- ConceptDraw Solution Park | Diagram Viewer Online Help | How to ...
- Time Line Chart For Online Library System
- Time Line Charts In Pdf For Online Libarey System
- Timeline Chart For Online Library System In Pdf
- Time Line Charts Online Library System
- Timeline Chart For Online Libarary System Project In Pdf
- Online Libaray System Project With Timeline Chart
- Time Line Chart For Online Library Management System
- Online Libaray System Project With Timeline Chart In Pdf
- How to Create a Timeline Diagram in ConceptDraw PRO ...
- ConceptDraw Solution Park | Online Diagram Tool | ConceptDraw ...
- Flow Chart Online | How To Create a PERT Chart | How to Create a ...
- Online Timeline Generator
- Timeline Chart For Online Library System In Pdf Com
- How to Create a Timeline Diagram in ConceptDraw PRO | How To ...