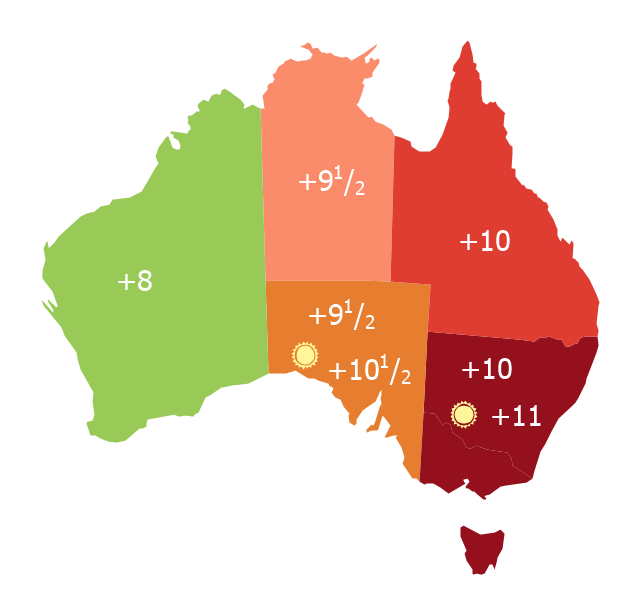
Map of Australia depicting time zones offsets from UTC by state (including daylight saving).
"Time in Australia uses more than three time zones, including Australian Western Standard Time (AWST; UTC+08:00), Australian Central Standard Time (ACST; UTC+09:30), and Australian Eastern Standard Time (AEST; UTC+10:00). Time is regulated by the individual state governments, some of which observe daylight saving time (DST). Australia's external territories observe different time zones." [Time in Australia. Wikipedia]
This thematic map was redesigned from Wikipedia file: Australia states timezones.png. [commons.wikimedia.org/ wiki/ File:Australia-states-timezones.png]
This file is licensed under the Creative Commons Attribution-Share Alike 3.0 Unported license.
[creativecommons.org/ licenses/ by-sa/ 3.0/ deed.en]
The thematic map example "Australia states time zones" was created using the ConceptDraw PRO diagramming and vector drawing software extended with the Continent Maps solution from the Maps area of ConceptDraw Solution Park.
Thematic map - Australia states time zones
"A thematic map is a type of map or chart especially designed to show a particular theme connected with a specific geographic area. ...
A thematic map is a map that focuses on a specific theme or subject area, whereas in a general map the variety of phenomena - geological, geographical, political - regularly appear together. ...
Thematic maps emphasize spatial variation of one or a small number of geographic distributions. These distributions may be physical phenomena such as climate or human characteristics such as population density and health issues. ...
Thematic map are sometimes referred to as graphic essays that portray spatial variations and interrelationships of geographical distributions. Location, of course, is important to provide a reference base of where selected phenomena are occurring. ...
Thematic maps serve three primary purposes.
First, they provide specific information about particular locations.
Second, they provide general information about spatial patterns.
Third, they can be used to compare patterns on two or more maps." [Thematic map. Wikipedia]
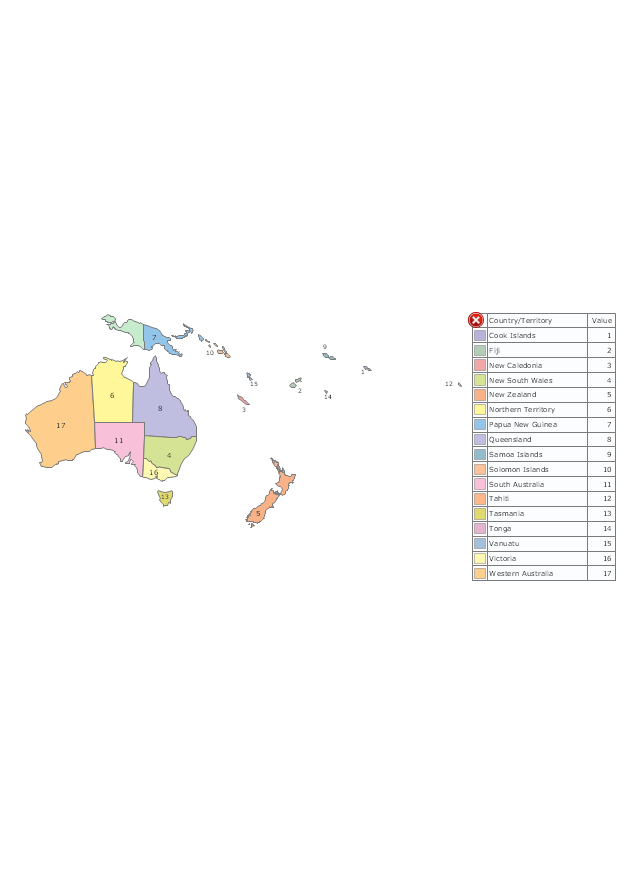
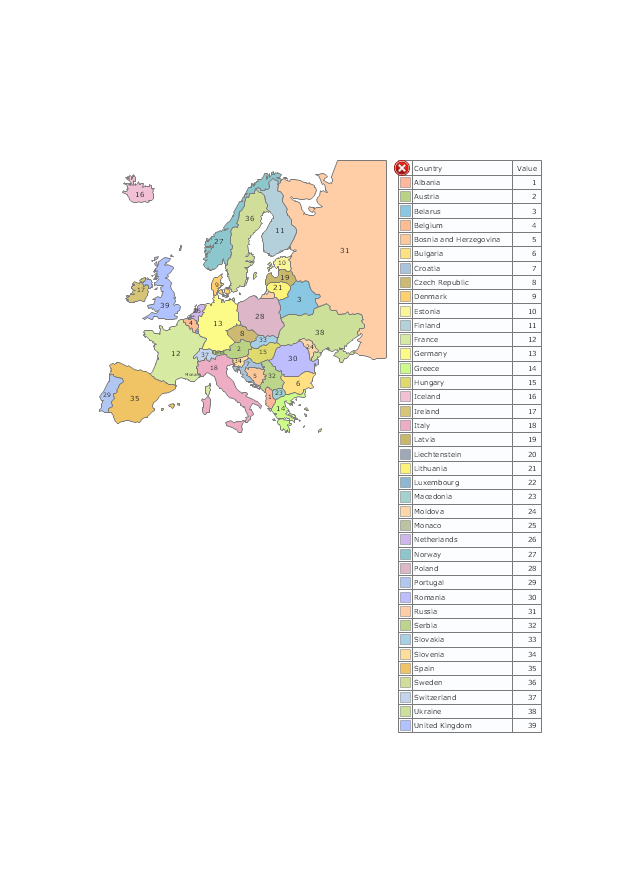
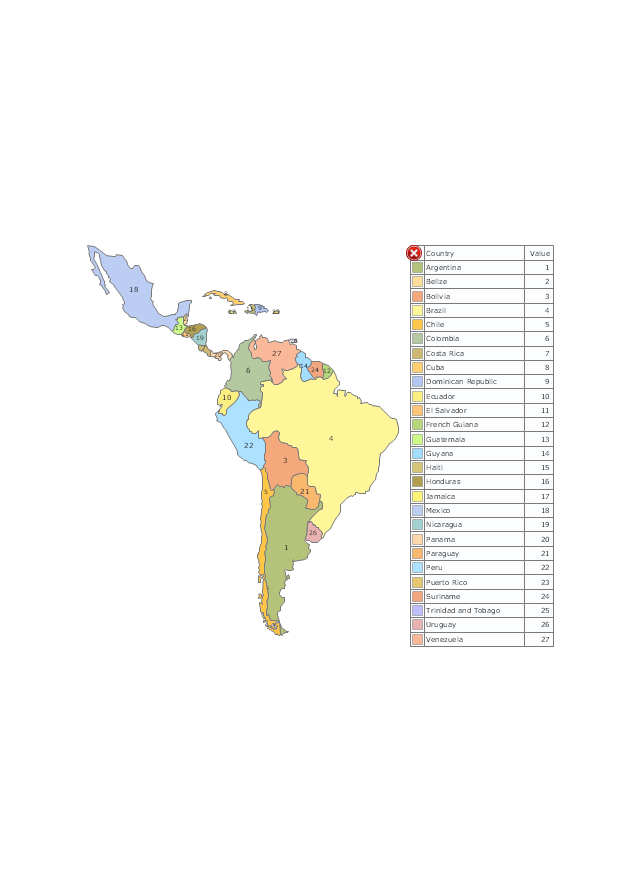
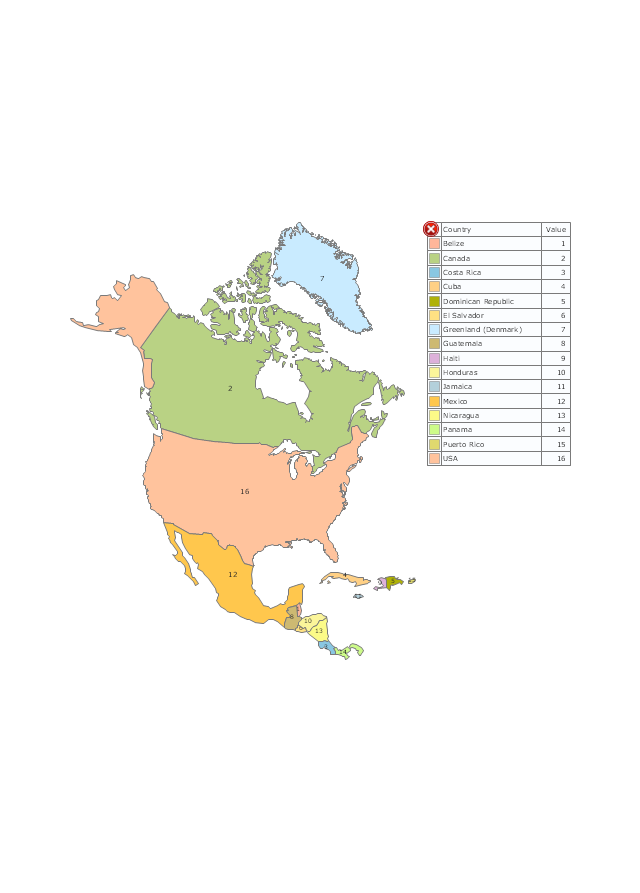
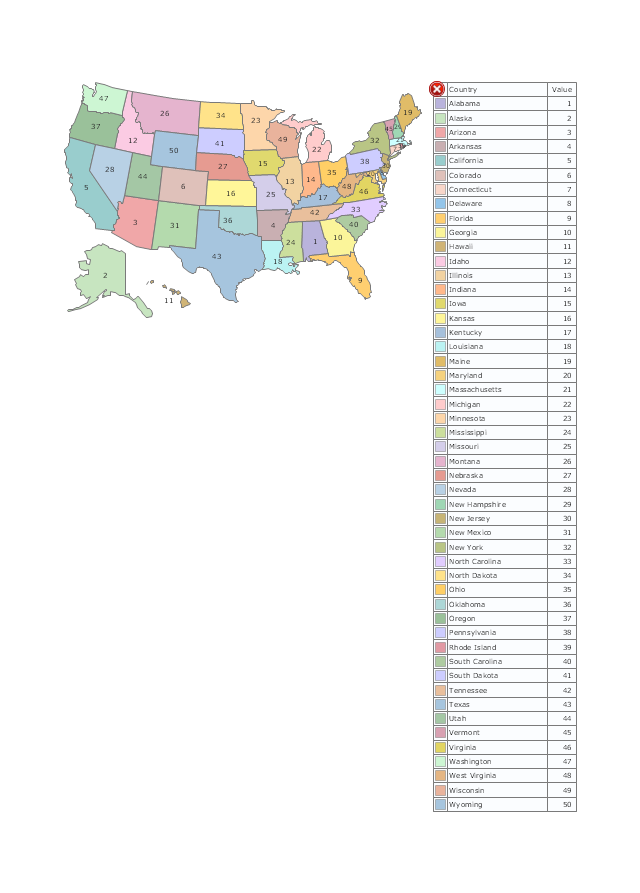
The vector stencils library "Thematic maps" contains 7 continent map contours for creating the thematic maps of geographic regions displaying the metric values by countries, states and territories marked by different colors.
Use the design elements library "Thematic maps" to create spatial dashboards using the ConceptDraw PRO diagramming and vector drawing software for your Spatial Intelligence and Location Intelligence business practice.
The example "Design elements - Thematic maps" is included in the Spatial Dashboard solution from the area "What is a Dashboard" of ConceptDraw Solution Park.
A thematic map is a map that focuses on a specific theme or subject area, whereas in a general map the variety of phenomena - geological, geographical, political - regularly appear together. ...
Thematic maps emphasize spatial variation of one or a small number of geographic distributions. These distributions may be physical phenomena such as climate or human characteristics such as population density and health issues. ...
Thematic map are sometimes referred to as graphic essays that portray spatial variations and interrelationships of geographical distributions. Location, of course, is important to provide a reference base of where selected phenomena are occurring. ...
Thematic maps serve three primary purposes.
First, they provide specific information about particular locations.
Second, they provide general information about spatial patterns.
Third, they can be used to compare patterns on two or more maps." [Thematic map. Wikipedia]
The vector stencils library "Thematic maps" contains 7 continent map contours for creating the thematic maps of geographic regions displaying the metric values by countries, states and territories marked by different colors.
Use the design elements library "Thematic maps" to create spatial dashboards using the ConceptDraw PRO diagramming and vector drawing software for your Spatial Intelligence and Location Intelligence business practice.
The example "Design elements - Thematic maps" is included in the Spatial Dashboard solution from the area "What is a Dashboard" of ConceptDraw Solution Park.
Thematic map templates
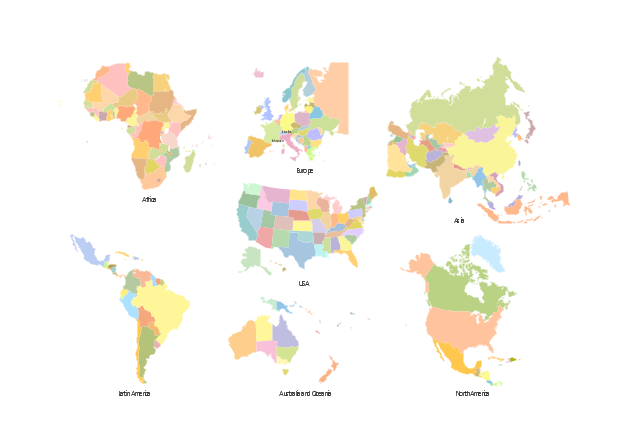
The vector stencils library "Thematic maps" contains 7 continent map contours.
Use it for drawing thematic maps of geographic regions displaying the metric values by countries, states and territories marked by different colors in the ConceptDraw PRO diagramming and vector drawing software extended with the Spatial Dashboard solution from the area "What is a Dashboard" of ConceptDraw Solution Park.
Use it for drawing thematic maps of geographic regions displaying the metric values by countries, states and territories marked by different colors in the ConceptDraw PRO diagramming and vector drawing software extended with the Spatial Dashboard solution from the area "What is a Dashboard" of ConceptDraw Solution Park.
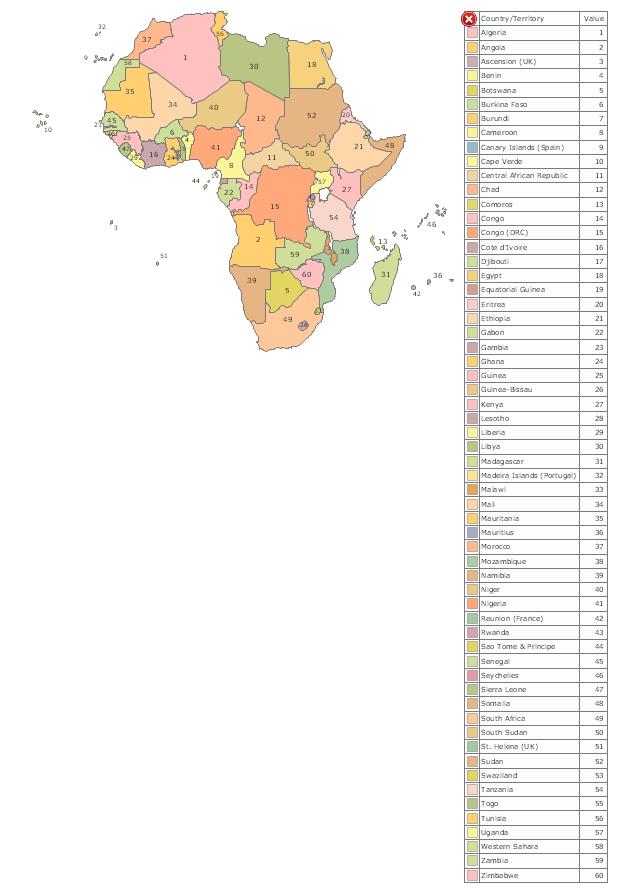
Africa
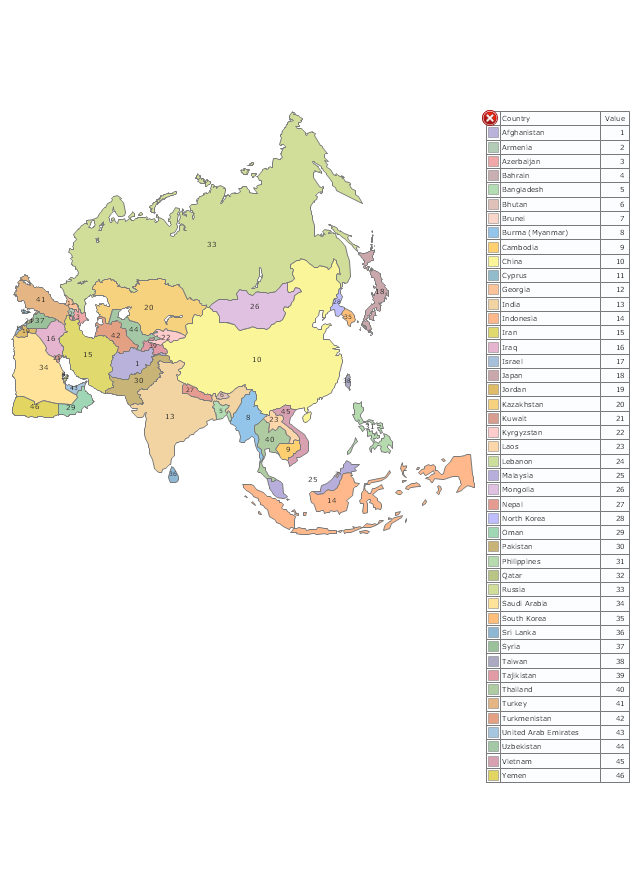
Asia
Australia and Oceania
Europe
Latin America
North America
USA
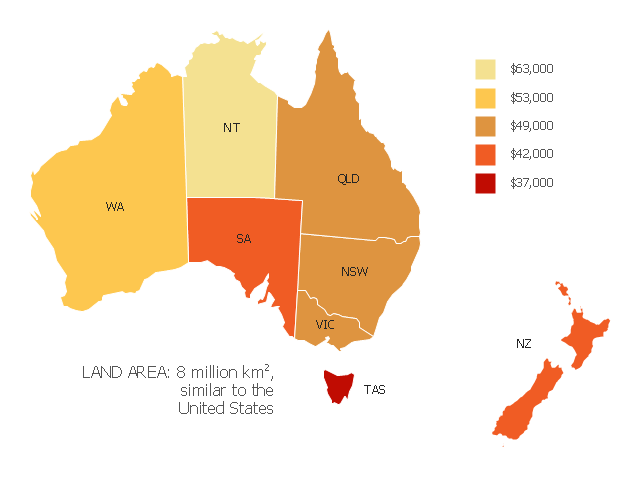
"Household income is a measure of the combined incomes of all people sharing a particular household or place of residence. It includes every form of income, e.g., salaries and wages, retirement income, near cash government transfers like food stamps, and investment gains.
Average household income can be used as an indicator for the monetary well-being of a country's citizens. Mean or median net household income, after taxes and mandatory contributions, are good indicators of standard of living, because they include only disposable income and acknowledge people sharing accommodation benefit from pooling at least some of their living costs.
Average household incomes need not map directly to measures of an individual's earnings such as per capita income as numbers of people sharing households and numbers of income earners per household can vary significantly between regions and over time." [Household income. Wikipedia]
This map example shows 2007 median household incomes in the states and mainland territories of the Commonwealth of Australia.
The thematic map example "Map of median household income in Australia" was redesigned from the Wikimedia Commons file: Map of median household income in Australia.PNG.
[commons.wikimedia.org/ wiki/ File:Map_ of_ median_ household_ income_ in_ Australia.PNG]
The example "Map of median household income in Australia" was created using the ConceptDraw PRO diagramming and vector drawing software extended with the Continent Map solution from the Maps area of ConceptDraw Solution Park.
Thematic map - Australia
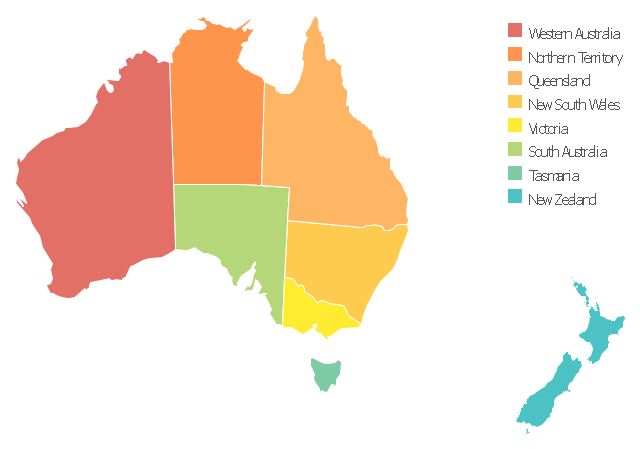
Use this template to design your Australia political map, cartogram or thematic map, to visualize your spatial business information connected with geographic areas, locations or ways.
This Australia map template for the ConceptDraw PRO diagramming and vector drawing software is included in the Continent Maps solution from the Maps area of ConceptDraw Solution Park.
This Australia map template for the ConceptDraw PRO diagramming and vector drawing software is included in the Continent Maps solution from the Maps area of ConceptDraw Solution Park.
Australia thematic map template
The vector stencils library "Thematic maps" contains 7 continent map contours.
Use it for drawing thematic maps of geographic regions displaying the metric values by countries, states and territories marked by different colors in the ConceptDraw PRO diagramming and vector drawing software extended with the Spatial Dashboard solution from the area "What is a Dashboard" of ConceptDraw Solution Park.
Use it for drawing thematic maps of geographic regions displaying the metric values by countries, states and territories marked by different colors in the ConceptDraw PRO diagramming and vector drawing software extended with the Spatial Dashboard solution from the area "What is a Dashboard" of ConceptDraw Solution Park.
Africa
Asia
Australia and Oceania
Europe
Latin America
North America
USA
- Australia states time zones - Thematic map | Continent Maps | Geo ...
- Australia states time zones - Thematic map | 7 Continents Map ...
- USA Maps | Australia states time zones - Thematic map | 7 ...
- Design elements - Thematic maps | Name Three Primary Purposes ...
- Australia states time zones - Thematic map | Geo Map - Australia ...
- Map Australia | Geo Map - Asia - Israel | Competitor Analysis | Name ...
- Australia states time zones - Thematic map | Australia map ...
- Design elements - Thematic maps | Visualization Spatial Data Using ...
- Visualization Spatial Data Using Thematic Maps Combined with ...