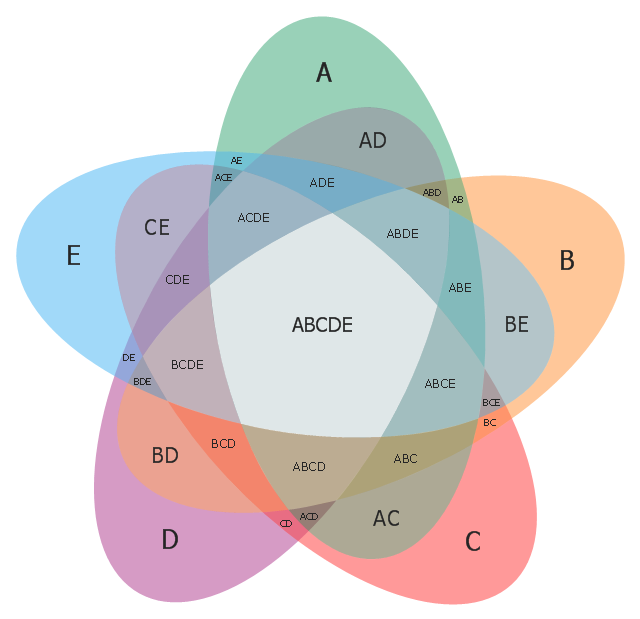
Use this template to design your five set Venn diagrams.
"Five-set Venn diagram using congruent ellipses in a radially symmetrical arrangement devised by Branko Grünbaum. Labels have been simplified for greater readability." [Venn diagram. Wikipedia]
The template "5-set Venn diagram" for the ConceptDraw PRO diagramming and vector drawing software is included in the Venn Diagrams solution from the area "What is a Diagram" of ConceptDraw Solution Park.
Template
"A process flow diagram (PFD) is a diagram commonly used in chemical and process engineering to indicate the general flow of plant processes and equipment. The PFD displays the relationship between major equipment of a plant facility and does not show minor details such as piping details and designations. Another commonly used term for a PFD is a flowsheet. ...
Process flow diagrams of multiple process units within a large industrial plant will usually contain less detail and may be called block flow diagrams or schematic flow diagrams." [Process flow diagram. Wikipedia]
The process flow diagram (PFD) template for the ConceptDraw PRO diagramming and vector drawing software is included in the Chemical and Process Engineering solution from the Engineering area of ConceptDraw Solution Park.
Process flow diagram (PFD) template
-template-process-flow-diagram-(pfd)-template.png--diagram-flowchart-example.png)
HelpDesk
How to Create the Custom Diagram Template
Cisco Network Templates


Use this template to design your four set Venn diagrams.
In maths logic Venn diagram is "a diagram in which mathematical sets or terms of a categorial statement are represented by overlapping circles within a boundary representing the universal set, so that all possible combinations of the relevant properties are represented by the various distinct areas in the diagram". [thefreedictionary.com/ Venn+diagram]
The template "4-set Venn diagram" for the ConceptDraw PRO diagramming and vector drawing software is included in the Venn Diagrams solution from the area "What is a Diagram" of ConceptDraw Solution Park.
Template

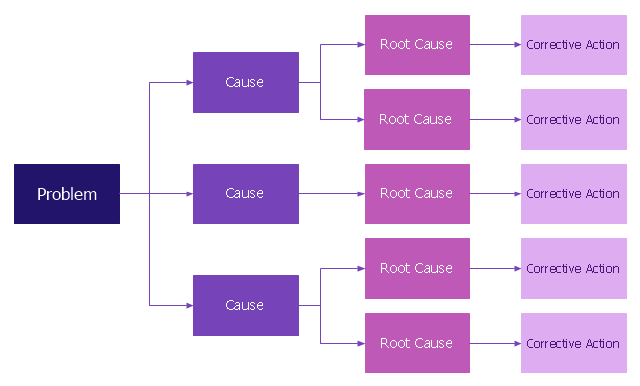
Root cause analysis (RCA) tree diagram lets identify the root causes for a factor and then list possible corrective action. The diagram displays the structure of causes for a factor and possible corrective actions. The root cause analysis tree diagram is used for further formulation of actions.
"Tree Diagram.
This tool is used to break down broad categories into finer and finer levels of detail. It can map levels of details of tasks that are required to accomplish a goal or solution or task. Developing the tree diagram helps one move their thinking from generalities to specifics." [Seven Management and Planning Tools. Wikipedia]
This root cause analysis tree diagram template for the ConceptDraw PRO diagramming and vector drawing software is included in the Seven Management and Planning Tools solution from the Management area of ConceptDraw Solution Park.
RCA diagram
"Process Decision Program Chart (PDPC).
A useful way of planning is to break down tasks into a hierarchy, using a tree diagram. The PDPC extends the tree diagram a couple of levels to identify risks and countermeasures for the bottom level tasks. Different shaped boxes are used to highlight risks and identify possible countermeasures (often shown as 'clouds' to indicate their uncertain nature). The PDPC is similar to the Failure Modes and Effects Analysis (FMEA) in that both identify risks, consequences of failure, and contingency actions; the FMEA also rates relative risk levels for each potential failure point." [Seven Management and Planning Tools. Wikipedia]
The Risk diagram (process decision program chart, PDPC) determines the risks when corrective action is not performed correctly. Also, it helps develop descriptions for preventive actions at the level of execution.
The Risk diagram (PDPC) template for the ConceptDraw PRO diagramming and vector drawing software is included in the solution "Seven Management and Planning Tools" from the Management area of ConceptDraw Solution Park.
Risk diagram
---template.png--diagram-flowchart-example.png)
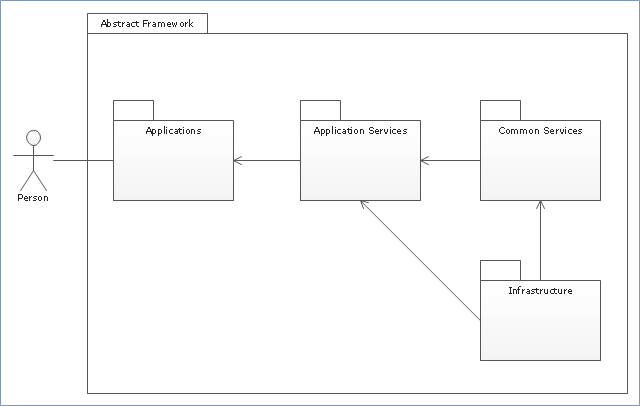
"Package diagram is UML structure diagram which shows packages and dependencies between the packages.
Model diagrams allow to show different views of a system, for example, as multi-layered (aka multi-tiered) application - multi-layered application model.
The following nodes and edges are typically drawn in a package diagram: package, packageable element, dependency, element import, package import, package merge." [uml-diagrams.org/ package-diagrams.html]
The template "UML package diagram" for the ConceptDraw PRO diagramming and vector drawing software is included in the Rapid UML solution from the Software Development area of ConceptDraw Solution Park.
www.conceptdraw.com/ solution-park/ software-uml
UML package diagram
"Causes in the diagram are often categorized, such as to the 6 M's ...
The 6 Ms (used in manufacturing industry):
(1) Machine (technology);
(2) Method (process);
(3) Material (Includes Raw Material, Consumables and Information.);
(4) Man Power (physical work)/ Mind Power (brain work): Kaizens, Suggestions;
(5) Measurement (Inspection);
(6) Milieu/ Mother Nature (Environment).
The original 6Ms used by the Toyota Production System have been expanded by some to include the following and are referred to as the 8Ms. However, this is not globally recognized. It has been suggested to return to the roots of the tools and to keep the teaching simple while recognizing the original intent; most programs do not address the 8Ms.
(7) Management/ Money Power;
(8) Maintenance." [Ishikawa diagram. Wikipedia]
This 8Ms Ishikawa diagram (manufacturing cause and effect diagram) template is included in the Fishbone Diagram solution from the Management area of ConceptDraw Solution Park.
8Ms Ishikawa diagram

"A swim lane (or swimlane) is a visual element used in process flow diagrams, or flowcharts, that visually distinguishes responsibilities for sub-processes of a business process. Swim lanes may be arranged either horizontally or vertically. In the accompanying example, the swimlanes are named Customer, Sales, Contracts, Legal, and Fulfillment, and are arranged vertically. ...
When used to diagram a business process that involves more than one department, swimlanes often serve to clarify not only the steps and who is responsible for each one, but also how delays, mistakes or cheating are most likely to occur.
Many process modeling methodologies utilize the concept of swimlanes, as a mechanism to organize activities into separate visual categories in order to illustrate different functional capabilities or responsibilities (organisational roles). Swimlanes are used in Business Process Modeling Notation (BPMN) and Unified Modeling Language activity diagram modeling methodologies." [Swim lane. Wikipedia]
The template "UML activity diagram (swimlanes)" for the ConceptDraw PRO diagramming and vector drawing software is included in the Rapid UML solution from the Software Development area of ConceptDraw Solution Park.
www.conceptdraw.com/ solution-park/ software-uml
UML activity diagram (swimlanes)
-uml-activity-diagram-(swimlanes)---template.png--diagram-flowchart-example.png)
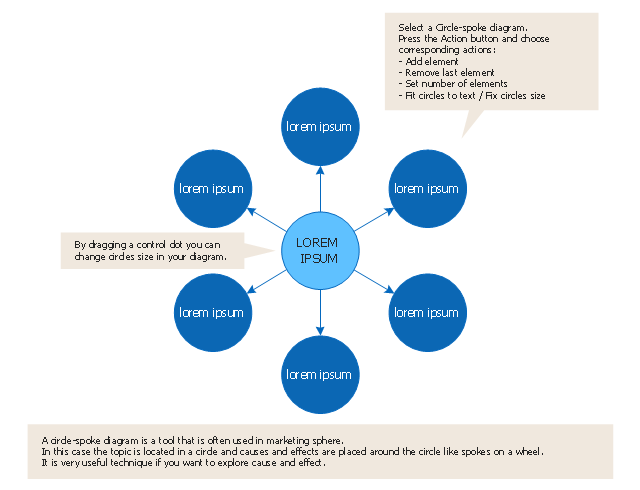
Сircle-Spoke Diagrams (Spoke charts) have a central item surrounded by other items in a circle. They are used to show the features or components of the central item in marketing and management documents and presentations.
The template "Circle spoke diagram" for the ConceptDraw PRO diagramming and vector drawing software is included in the Circle-Spoke Diagrams solution from the area "What is a Diagram" of ConceptDraw Solution Park.
The template "Circle spoke diagram" for the ConceptDraw PRO diagramming and vector drawing software is included in the Circle-Spoke Diagrams solution from the area "What is a Diagram" of ConceptDraw Solution Park.
Template
- UML activity diagram - Template
- Root cause analysis tree diagram - Template | Fault Tree Analysis ...
- IDEF0 diagram template | Process Flowchart | IDEF0 Diagram ...
- UML component diagram - Template
- Physical LAN and WAN diagram - Template
- UML package diagram - Template | UML communication diagram ...
- Process Flowchart | Process flow diagram (PFD) template | Business ...
- Timing diagram | UML timing diagram - Template | Diagramming ...
- Manufacturing 8 Ms fishbone diagram - Template | Business ...
- Circular Flow Diagram Template
- Business process swim lane diagram BPMN 1.2 - Template | Swim ...
- Process Engineering | Process flow diagram (PFD) template ...
- Pyramid diagram - Template | Pyramid Diagram and Pyramid Chart ...
- Data Flow Diagram (DFD) | Context Diagram Template | DFD Library ...
- Physical LAN and WAN diagram - Template | Network Diagram ...
- Data Flow Diagrams | Process Flowchart | Visio Files and ...
- 5-Set Venn diagram - Template
- Functional Block Diagram | Context Diagram Template | Functional ...
- Gane Sarson Diagram | DFD, Gane-Sarson notation - Template ...
- Computer Network Diagrams | Network Layout Floor Plans | Cisco ...