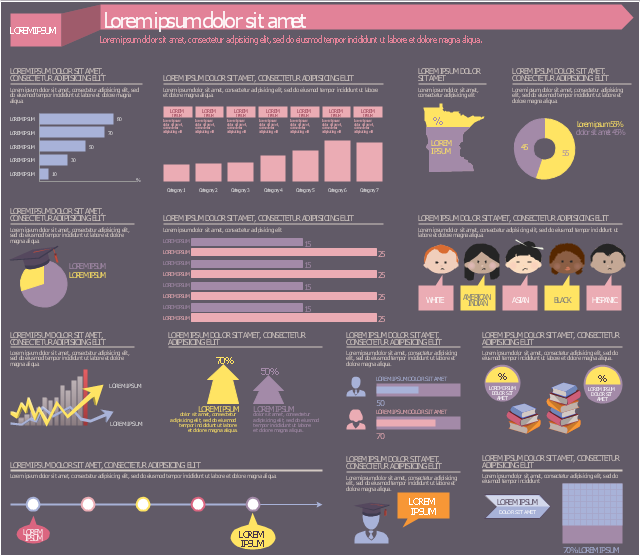
This education infographic template consists of design elements: callouts, horizontal bar chart, column chart (vertical bar graph), state map contour, donut chart indicator, pie chart indicator, horizontal bar chart indicators, arrow chart indicator, bullet indicators, square chart 10x10 indicator, pictograms.
Simply add text to design your own educational infogram.
The template "Education infogram 5" for the ConceptDraw PRO diagramming and vector drawing software is included in the Education Infographics solition from the area "Business Infographics" in ConceptDraw Solution Park.
Simply add text to design your own educational infogram.
The template "Education infogram 5" for the ConceptDraw PRO diagramming and vector drawing software is included in the Education Infographics solition from the area "Business Infographics" in ConceptDraw Solution Park.
Educational infogram template
Used Solutions
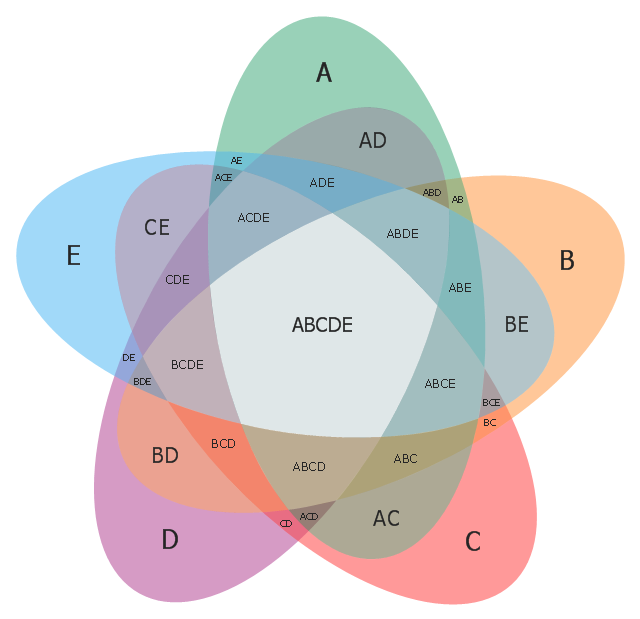
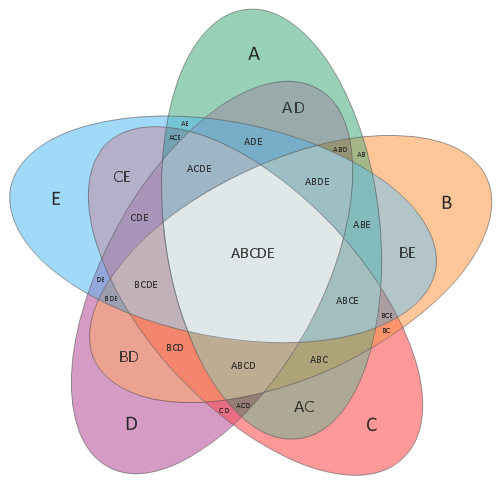
Use this template to design your five set Venn diagrams.
"Five-set Venn diagram using congruent ellipses in a radially symmetrical arrangement devised by Branko Grünbaum. Labels have been simplified for greater readability." [Venn diagram. Wikipedia]
The template "5-set Venn diagram" for the ConceptDraw PRO diagramming and vector drawing software is included in the Venn Diagrams solution from the area "What is a Diagram" of ConceptDraw Solution Park.
Template
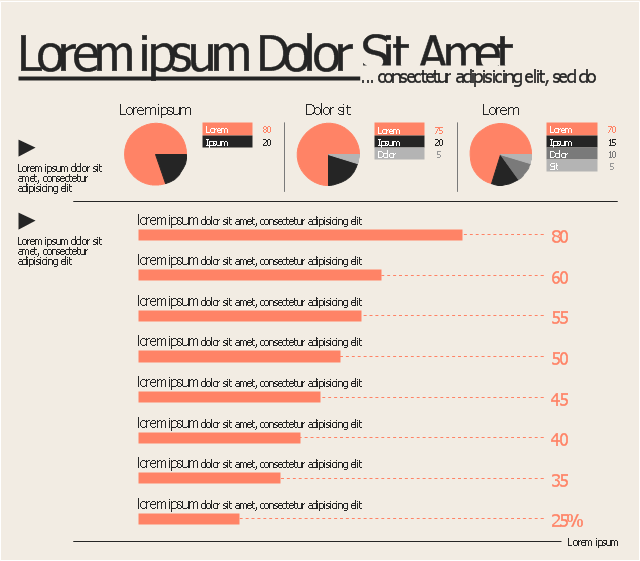
This marketing infographic template consists of design elements: title block, callout blocks, list bullets, pie chart, bullet indicators.
Use it to create your marketing infograms in the ConceptDraw PRO diagramming and vector drawing software.
The template "Marketing infogram 5" is included in the Marketing Infographics solution from the Business Infographics area of ConceptDraw Solution Park.
Use it to create your marketing infograms in the ConceptDraw PRO diagramming and vector drawing software.
The template "Marketing infogram 5" is included in the Marketing Infographics solution from the Business Infographics area of ConceptDraw Solution Park.
Marketing infogram template
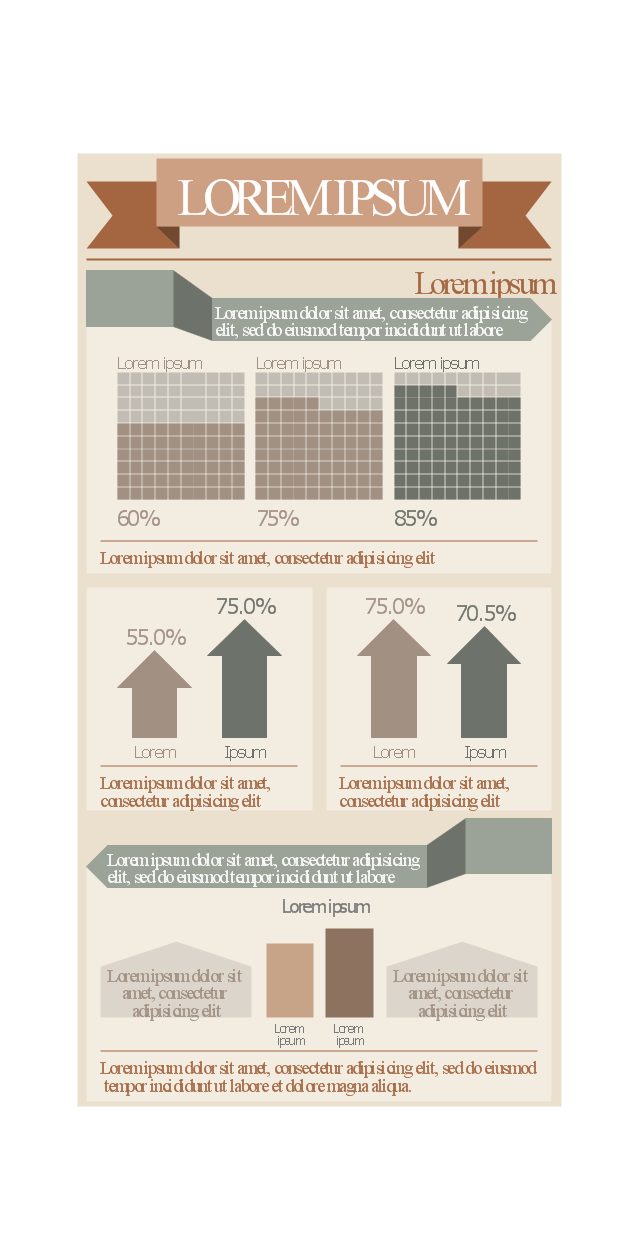
This template contains common design elements of business infographic: title and text blocks, callouts, charts and pictograms.
Use this template to create your own management infogram using the ConceptDraw PRO diagramming and vector drawing software and the Management Infographics solition from the area "Business Infographics" in ConceptDraw Solution Park.
Use this template to create your own management infogram using the ConceptDraw PRO diagramming and vector drawing software and the Management Infographics solition from the area "Business Infographics" in ConceptDraw Solution Park.
Management infogram template
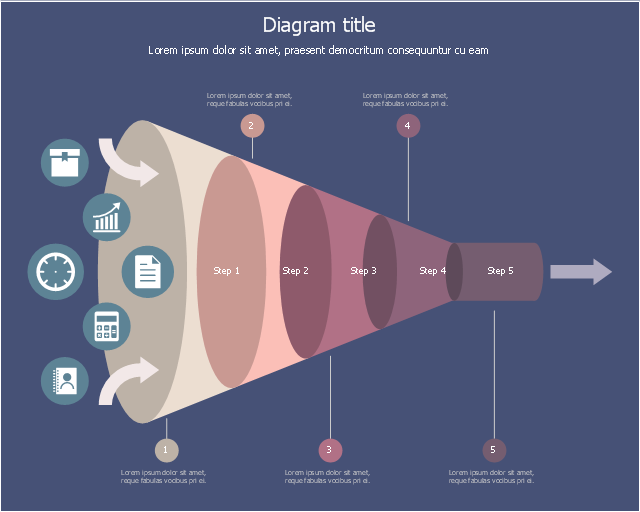
This is funnel diagram template.
Use it to design your funnel diagrams with ConceptDraw PRO software.
The marketing diagram template "5-stage 3D horizontal funnel" is included in Funnel Diagrams solution from Marketing area of ConceptDraw Solution Park.
Use it to design your funnel diagrams with ConceptDraw PRO software.
The marketing diagram template "5-stage 3D horizontal funnel" is included in Funnel Diagrams solution from Marketing area of ConceptDraw Solution Park.
Marketing diagram template
 Computer Network Diagrams
Computer Network Diagrams solution extends ConceptDraw DIAGRAM software with samples, templates and libraries of vector icons and objects of computer network devices and network components to help you create professional-looking Computer Network Diagrams, to plan simple home networks and complex computer network configurations for large buildings, to represent their schemes in a comprehensible graphical view, to document computer networks configurations, to depict the interactions between network's components, the used protocols and topologies, to represent physical and logical network structures, to compare visually different topologies and to depict their combinations, to represent in details the network structure with help of schemes, to study and analyze the network configurations, to communicate effectively to engineers, stakeholders and end-users, to track network working and troubleshoot, if necessary.
Mechanical Drawing Software

Venn Diagram Template
Design Pictorial Infographics. Design Infographics

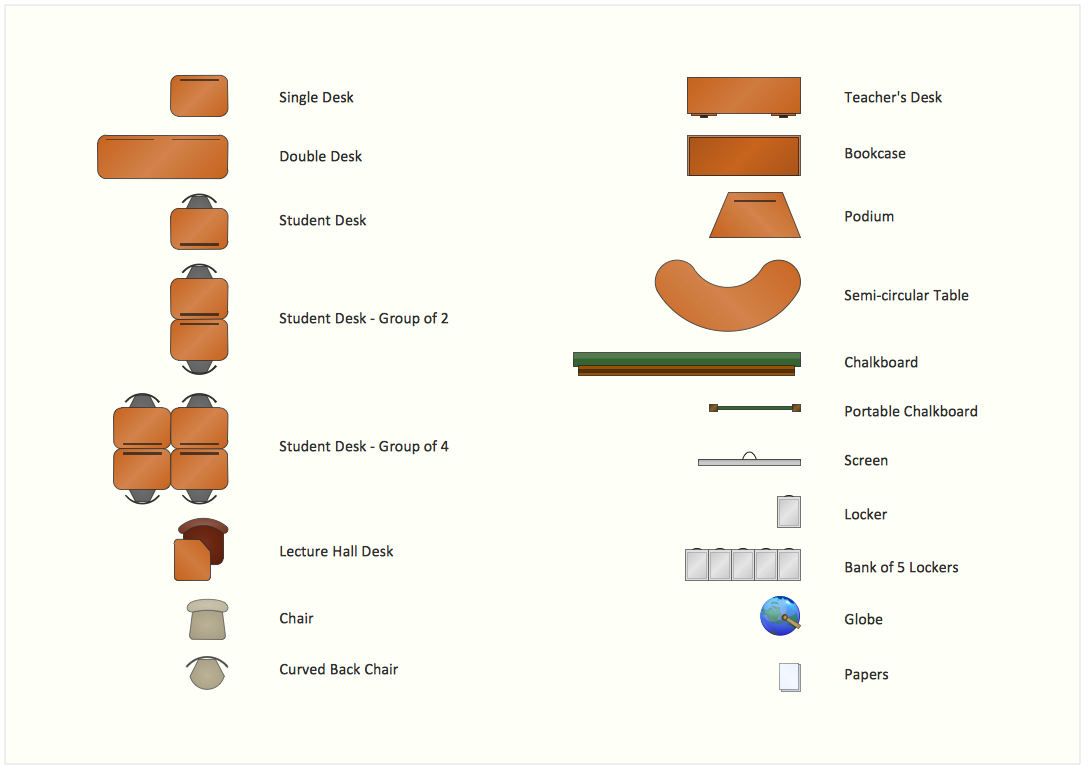
Interior Design. School Layout — Design Elements
- Pneumatic 5 -ported 3-position valve template - Mac | Design ...
- Design elements - Pneumatic pumps and motors | Pneumatic 5 ...
- Design elements - Fluid power valves | Pneumatic 5 -ported 3 ...
- Mechanical Drawing Symbols | Pneumatic 5 -ported 3-position valve ...
- Top 5 Android Flow Chart Apps | Software development with ...
- Hydraulic 5 -ported 3-position valve template - Win | Hydraulic ...
- Pneumatic 5 -ported 3-position valve template - Mac | Mechanical ...
- Education infogram - Template | Education infogram 5 - Template ...
- Minnesota measures - Infogram | Education infogram - Template ...
- 5 -Set Venn diagram - Template | Venn Diagram Template for Word ...