HelpDesk
How to Create a Timeline Diagram in ConceptDraw PRO
A Timeline is a chart which displays a project plan schedule in chronological order. A Timeline is used in project management to depict project milestones and visualize project phases, and show project progress. The graphic form of a timeline makes it easy to understand critical project milestones, such as the progress of a project schedule. Timelines are particularly useful for project scheduling or project management when accompanied with a Gantt chart. It captures the main of what the project will accomplish and how it will be done. making a project timeline is one of the most important skills a project manager needs have. Making comprehensive, accurate timelines allows you getting every project off in the best way. ConceptDraw PRO allows you to draw a timeline charts using special library.HelpDesk
How to Create Flowchart Using Standard Flowchart Symbols
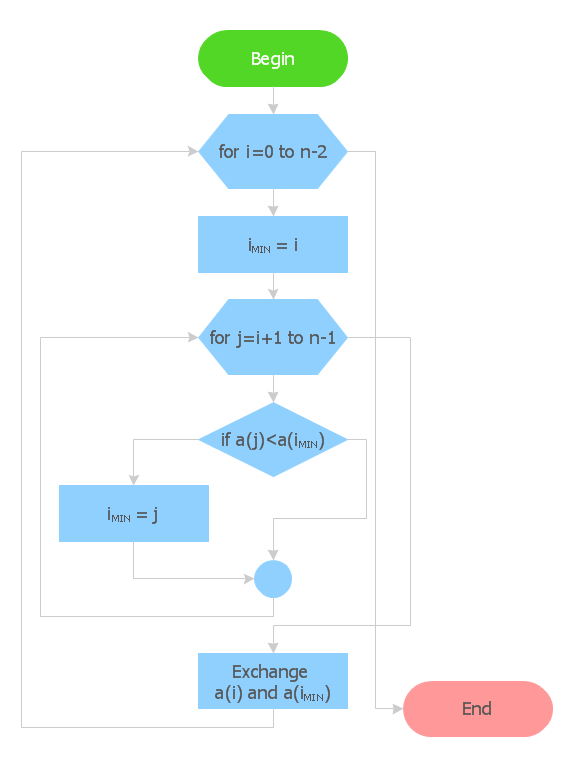
Flowcharts are used to display an algorithm for consistent execution of certain steps. Flowchart is probably the easiest way to make a graphical representation of any process. Flowcharts use the set of standard geometric symbols and arrows to define relationships. ConceptDraw PRO allows you to create professional flowchart quickly and easily. The ability to create flowcharts is contained in the Flowcharts solution. The solution provides a set of special tools for creating flowcharts.
 Event-driven Process Chain Diagrams
Event-driven Process Chain (EPC) Diagram is a type of flowchart widely used for modeling in business engineering and reengineering, business process improvement, and analysis. EPC method was developed within the Architecture of Integrated Information Systems (ARIS) framework.
HelpDesk
How to Create a Fault Tree Analysis Diagram (FTD) in ConceptDraw PRO
Fault Tree Diagram are logic diagram that shows the state of an entire system in a relationship of the conditions of its elements. Fault Tree Diagram are used to analyze the probability of functional system failures and safety accidents. ConceptDraw PRO allows you to create professional Fault Tree Diagrams using the basic FTD symbols. An FTD visualize a model of the processes within a system that can lead to the unlikely event. A fault tree diagrams are created using standard logic symbols . The basic elements in a fault tree diagram are gates and events.
 ConceptDraw Solution Park
ConceptDraw Solution Park collects graphic extensions, examples and learning materials
HelpDesk
ConceptDraw Office for Apple macOS Installation Definition
With the introduction of version 3, ConceptDraw Office has been redesigned to better accommodate future developments and solution plugins. ConceptDraw Office 3 includes ConceptDraw PRO 10, ConceptDraw MINDMAP 8, and ConceptDraw PROJECT 7. The renewed ConceptDraw STORE helps user manage downloads of ConceptDraw products and solutions. The following article provides owners of the previous versions of ConceptDraw products with important information on updating on ConceptDraw Office v3.HelpDesk
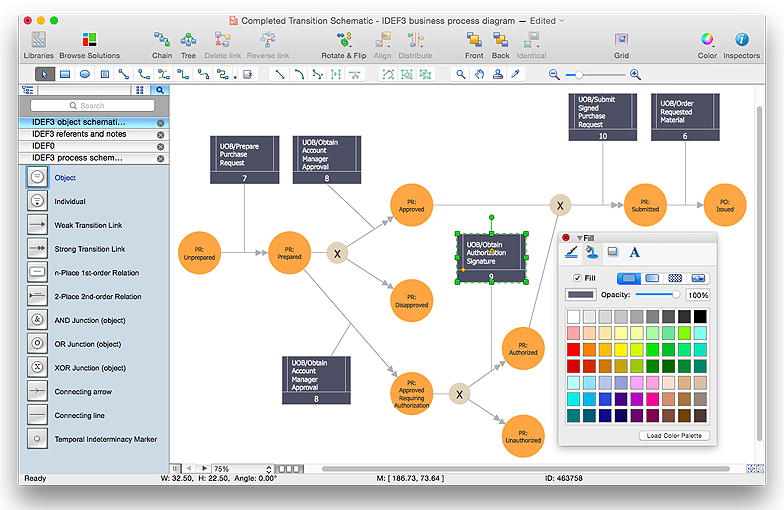
How to create an IDEF3 diagram using ConceptDraw PRO
IDEF3 is a member of the IDEF family of modeling methods that can be used to describe operations in a business process. An IDEF3 diagram provides a description of actual process flow within an organization or business, or the changes that occur to an object within that system. This method of knowledge capture is recorded in two different perspectives - users are able to create both process schematics and object schematics using the IDEF3 schematic symbols. ConceptDraw has created a solution that collects all symbols necessary to create professional IDEF3 diagrams. IDEF methodology is suitable for almost any form of business, and for anyone who needs to record enterprise architecture in a process driven manner. The IDEF Business Process Diagram solution and ConceptDraw PRO cater for these needs, giving both beginner and experienced users the tools they need to create effective business process diagrams.
 Azure Architecture
Azure Architecture solution bundles into one handy tool everything you need to create effective Azure Architecture diagrams. It adds the extra value to versatile ConceptDraw PRO software and extends the users capabilities with comprehensive collection of Microsoft Azure themed graphics, logos, preset templates, wide array of predesigned vector symbols that covers the subjects such as Azure management, Azure storage, and Azure services, amongst others, and allow you to illustrate Azure Architecture diagrams at any degree of complexity, to present visually your Azure cloud system architecture with professional style, to design Azure cloud topology, to document Windows Azure Architecture and Azure Cloud System Architecture, to visualize the great abilities and work of Microsoft Azure Cloud System and Azure services.
HelpDesk
ConceptDraw Office for Windows Installation Definition
With the introduction of version 3, ConceptDraw Office has been redesigned to better accommodate future developments and solution plugins. ConceptDraw Office 3 includes ConceptDraw PRO 10, ConceptDraw MINDMAP 8, and ConceptDraw PROJECT 7. Owners of ConceptDraw Office v1 and ConceptDraw Office v2, please read this description of the specific features of the ConceptDraw Office 3 installation for Windows before updating.- Network Diagram Symbols
- Data Flow Diagram Symbols . DFD Library | Entity Relationship ...
- Basic Flowchart Symbols and Meaning | Network Diagram Software ...
- Basic Flowchart Symbols and Meaning | Workflow diagram ...
- Cisco Network Topology. Cisco icons, shapes, stencils and symbols ...
- Basic Wiring Schematic Symbols And Definitions
- Telecommunication Network Diagrams | Design elements ...
- Basic Flowchart Symbols and Meaning | Basic Diagramming | Basic ...
- Basic Flowchart Symbols and Meaning | Network Diagram Software ...
- Local Area Network Diagram
- Process Flowchart | Entity Relationship Diagram Symbols and ...
- Entity Relationship Diagram Symbols and Meaning ERD Symbols ...
- Basic Flowchart Symbols and Meaning | Audio and Video ...
- Data Flow Diagrams (DFD) | Basic Flowchart Symbols and Meaning ...
- Design elements - Bank UML composite structure diagram | Basic ...
- Wireless access point - Network diagram | Roaming wireless local ...
- Basic Flowchart Symbols and Meaning | Local area network (LAN ...
- Process Flowchart | Basic Flowchart Symbols and Meaning | Create ...
- How To use Switches in Network Diagram | Cisco Switches and ...
- Computer and Networks Area | Network Layout Floor Plans ...


