 SWOT and TOWS Matrix Diagrams
SWOT and TOWS Matrix Diagrams solution extends ConceptDraw PRO and ConceptDraw MINDMAP software with features, templates, samples and libraries of vector stencils for drawing SWOT and TOWS analysis matrices and mind maps.
 Management
This solution extends ConceptDraw PRO v9 and ConceptDraw MINDMAP v7 with Management Diagrams and Mind Maps (decision making, scheduling, thinking ideas, problem solving, business planning, company organizing, SWOT analysis, preparing and holding meetings
ConceptDraw MINDMAP: Brainstorming, Mind Mapping for macOS and Windows

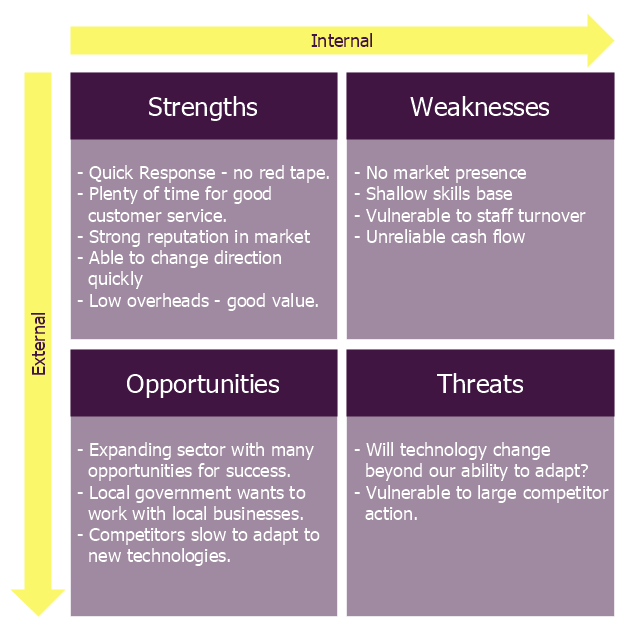
"The name says it: Strength, Weakness, Opportunity, Threat. A SWOT analysis guides you to identify the positives and negatives inside your organization (S-W) and outside of it, in the external environment (O-T). Developing a full awareness of your situation can help with both strategic planning and decision-making.
The SWOT method (which is sometimes called TOWS) was originally developed for business and industry, but it is equally useful in the work of community health and development, education, and even personal growth.
SWOT is not the only assessment technique you can use, but is one with a long track record of effectiveness. The strengths of this method are its simplicity and application to a variety of levels of operation." [ctb.ku.edu/ en/ table-of-contents/ assessment/ assessing-community-needs-and-resources/ swot-analysis/ main]
The diagram example "Small business consultancy SWOT analysis matrix" was created using the ConceptDraw PRO diagramming and vector drawing software extended with the SWOT Analysis solution from the Management area of ConceptDraw Solution Park.
SWOT matrix
Business Process Elements: Activities
")

 Interactive Voice Response Diagrams
Interactive Voice Response Diagrams solution extends ConceptDraw PRO v10 software with samples, templates and libraries of ready-to-use vector stencils that help create Interactive Voice Response (IVR) diagrams illustrating in details a work of interactive voice response system, the IVR system’s logical and physical structure, Voice-over-Internet Protocol (VoIP) diagrams, and Action VoIP diagrams with representing voice actions on them, to visualize how the computers interact with callers through voice recognition and dual-tone multi-frequency signaling (DTMF) keypad inputs.
 Cross-Functional Flowcharts
Cross-functional flowcharts are powerful and useful tool for visualizing and analyzing complex business processes which requires involvement of multiple people, teams or even departments. They let clearly represent a sequence of the process steps, the order of operations, relationships between processes and responsible functional units (such as departments or positions).
 Fishbone Diagram
Fishbone Diagrams solution extends ConceptDraw PRO software with templates, samples and library of vector stencils for drawing the Ishikawa diagrams for cause and effect analysis.
- Swot Analysis For Business Development Department
- SWOT Analysis | Business Package for Management | Competitor ...
- Sample Swot Analysis For Finance Department
- Swot Analysis Example Of Human Resource Department
- How to create a UML Diagram | How to Make SWOT Analysis in a ...
- Mind Maps for Business - SWOT Analysis | SWOT Analysis | How to ...
- Swot Analysis Of Software Department Example
- Quality Department Swot Analysis
- SWOT Matrix Template
- Competitor Analysis | Small business consultancy SWOT analysis ...
- Swot For Purchasing Department
- SWOT Analysis | Competitor Analysis | Cross-Functional Flowchart ...
- Swot On Hr Function
- SWOT Analysis | SWOT analysis matrix diagram templates | SWOT ...
- Swot For Import Department
- SWOT Analysis | Competitor Analysis | Scatter Chart Examples ...
- PM Agile | Marketing | Software Development | Swot Analysis Of
- Positioning Map | SWOT analysis positioning matrix - Template ...
- Sales Process Flowchart Symbols | Competitor Analysis | HVAC ...
- SWOT Analysis | Education Package | Business Package for ...