 Logistics Flow Charts
Logistics Flow Charts solution extends ConceptDraw PRO v11 functionality with opportunities of powerful logistics management software. It provides large collection of predesigned vector logistic symbols, pictograms, objects and clipart to help you design with pleasure Logistics flow chart, Logistics process flow diagram, Inventory flow chart, Warehouse flowchart, Warehouse management flow chart, Inventory control flowchart, or any other Logistics diagram. Use this solution for logistics planning, to reflect logistics activities and processes of an enterprise or firm, to depict the company's supply chains, to demonstrate the ways of enhancing the economic stability on the market, to realize logistics reforms and effective products' promotion.
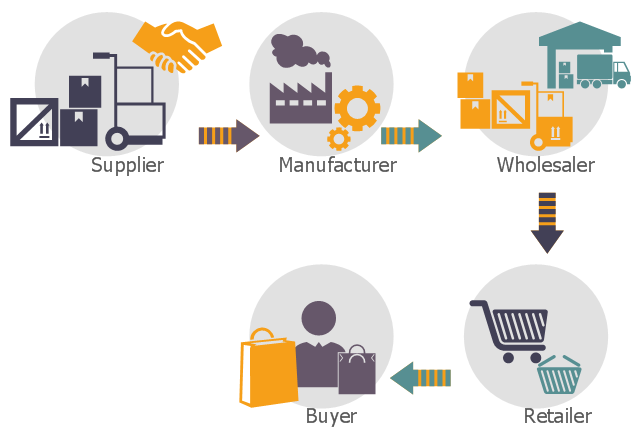
This logistic flow chart sample shows the groups in a supply chain cut out by disintermediation.
It was designed on the base of the Wikimedia Commons file: Disintermediation graphic.PNG. [commons.wikimedia.org/ wiki/ File:Disintermediation_ graphic.PNG]
This file is licensed under the Creative Commons Attribution-Share Alike 3.0 Unported license. [creativecommons.org/ licenses/ by-sa/ 3.0/ deed.en]
"In economics, disintermediation is the removal of intermediaries from a supply chain, or "cutting out the middlemen" in connection with a transaction or a series of transactions. Instead of going through traditional distribution channels, which had some type of intermediary (such as a distributor, wholesaler, broker, or agent), companies may now deal with customers directly, for example via the Internet." [Disintermediation. Wikipedia]
The logistic flowchart example "Groups in a supply chain cut out by disintermediation" was created using ConceptDraw PRO diagramming and vector drawing software extended with the Logistics Flow Charts solution from the Business Processes area of ConceptDraw Solution Park.
Logistic flowchart
HelpDesk
How to Make a Logistics Flow Chart

 Logistic Dashboard
The powerful tools of Logistic Dashboard solution and specially developed live graphic objects of logistic icons, logistic navigation elements, logistic indicators, logistic charts and logistic maps effectively assist in designing Logistic dashboards, Logistic maps, Logistic charts, diagrams and infographics. The included set of prebuilt samples and quick-start templates, demonstrates the power of ConceptDraw PRO software in logistics management, its assisting abilities in development, realization and analyzing the logistic processes, as well as in perfection the methods of logistics management.
This circular arrows diagram sample shows advanced persistent threat lifecycle.
It was designed on the base of the Wikimedia Commons file: Advanced persistent threat lifecycle.jpg.
[commons.wikimedia.org/ wiki/ File:Advanced_ persistent_ threat_ lifecycle.jpg]
This file is licensed under the Creative Commons Attribution-Share Alike 3.0 Unported license. [creativecommons.org/ licenses/ by-sa/ 3.0/ deed.en]
"Advanced Persistent Threat (APT) APT is a set of stealthy and continuous hacking processes often orchestrated by human targeting a specific entity. APT usually targets organizations and or nations for business or political motives. APT processes require high degree of covertness over a long period of time. As the name implies, APT consists of three major components/ processes: advanced, persistent, and threat. The advanced process signifies sophisticated techniques using malware to exploit vulnerabilities in systems. The persistent process suggests that an external command and control is continuously monitoring and extracting data off a specific target. The threat process indicates human involvement in orchestrating the attack.
APT usually refers to a group, such as a government, with both the capability and the intent to persistently and effectively target a specific entity. The term is commonly used to refer to cyber threats, in particular that of Internet-enabled espionage using a variety of intelligence gathering techniques to access sensitive information, but applies equally to other threats such as that of traditional espionage or attack. Other recognized attack vectors include infected media, supply chain compromise, and social engineering. Individuals, such as an individual hacker, are not usually referred to as an APT as they rarely have the resources to be both advanced and persistent even if they are intent on gaining access to, or attacking, a specific target." [Advanced persistent threat. Wikipedia]
The arrow donut chart example
"Advanced persistent threat lifecycle" was created using the ConceptDraw PRO diagramming and vector drawing software extended with the Circular Arrows Diagrams solution from the area "What is a Diagram" of ConceptDraw Solution Park.
Circular arrows diagram

HelpDesk
How to Make a Logistic Dashboard

- Supply Chain Order Process Flow Chart Template
- Supply Chain Business Process Flow Diagram
- Supply Chain Process Flow Diagram
- Supply Chain Process Flow Chart Templates
- Supply Chain Diagram Maker
- Logistics Flow Charts | Process Flowchart | Supply chain network ...
- Process Flowchart | Dhl Supply Chain Diagram
- Supply Chain Flow Chart Template
- Visio Stencils Supply Chain
- Supply Chain Management Flow Diagram
- Visio Supply Chain Examples
- Diagram Of Internal Supply Chain
- Supply Chain Management Er
- Supply Chain Chart Flow
- Supply Chain Diagram Process
- Draw Washing Machine Supply Chain Diagram
- Supply Chain Clipart
- Excel Supply Chain Template
- Download Logistics And Supply Chain Management In Visio
- Supply Chain Management Flow Chart