"Data flow diagrams are one of the three essential perspectives of the structured-systems analysis and design method SSADM. The sponsor of a project and the end users will need to be briefed and consulted throughout all stages of a system's evolution. With a data flow diagram, users are able to visualize how the system will operate, what the system will accomplish, and how the system will be implemented. The old system's dataflow diagrams can be drawn up and compared with the new system's data flow diagrams to draw comparisons to implement a more efficient system. Data flow diagrams can be used to provide the end user with a physical idea of where the data they input ultimately has an effect upon the structure of the whole system from order to dispatch to report. How any system is developed can be determined through a data flow diagram model.
In the course of developing a set of levelled data flow diagrams the analyst/ designers is forced to address how the system may be decomposed into component sub-systems, and to identify the transaction data in the data model.
Data flow diagrams can be used in both Analysis and Design phase of the SDLC.
There are different notations to draw data flow diagrams (Yourdon & Coad and Gane & Sarson), defining different visual representations for processes, data stores, data flow, and external entities." [Data flow diagram. Wikipedia]
The DFD (Yourdon and Coad notation) example "Process of account receivable" was created using the ConceptDraw PRO diagramming and vector drawing software extended with the Data Flow Diagrams solution from the Software Development area of ConceptDraw Solution Park.
Data Flow Diagram

 SYSML
SYSML
The SysML solution helps to present diagrams using Systems Modeling Language; a perfect tool for system engineering.
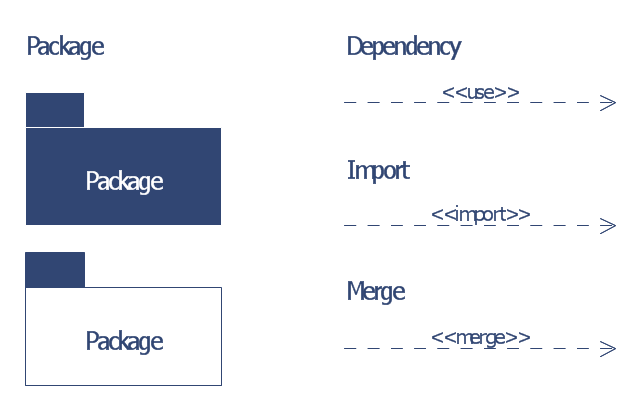
The vector stencils library "Bank UML package diagram" contains 5 shapes for drawing UML package diagrams.
Use it for object-oriented modeling of your bank information system.
"A package diagram in the Unified Modeling Language depicts the dependencies between the packages that make up a model.
In addition to the standard UML Dependency relationship, there are two special types of dependencies defined between packages:
* package import,
* package merge.
Elements.
1. Package: a general purpose mechanism for organizing model elements & diagrams into groups. It provides an encapsulated namespace within which all the names must be unique. It is used to group semantically related elements. It is a namespace as well as an element that can be contained in other packages' namespaces.
2. Class: a representation of an object that reflects its structure and behavior within the system. It is a template from which running instances are created. Classes usually describe the logical structure of the system.
3. Interface: a specification of behavior. An implementation class must be written to support the behavior of an interface class.
4. Object: an instance of a class. It is often used in analysis to represent an artifact or other item.
5. Table: a stereotyped class." [Package diagram. Wikipedia]
This example of UML package diagram symbols for the ConceptDraw PRO diagramming and vector drawing software is included in the ATM UML Diagrams solution from the Software Development area of ConceptDraw Solution Park.
UML package diagram symbols
- Structured Systems Analysis and Design Method (SSADM) with ...
- Structured Systems Analysis and Design Method (SSADM) with ...
- Data structure diagram with ConceptDraw PRO | Program Structure ...
- Process Flowchart | Structured Systems Analysis and Design ...
- Process Flowchart | Structured Systems Analysis and Design ...
- Process Flowchart | Structured Systems Analysis and Design ...
- Pyramid Diagram | Pyramid Diagram | Structured Systems Analysis ...
- Data Flow Diagrams | Data Flow Diagram | Structured Systems ...
- Data Flow Diagram | Process Flowchart | Types of Flowchart ...
- UML Diagram | Structured Systems Analysis and Design Method ...
- Process Flowchart | Data Flow Diagram | Structured Systems ...
- How To Draw Data Flow Diagram
- Workflow Diagram | Account Flowchart Stockbridge System ...
- Data Flow Diagrams (DFD) | Data Flow Diagrams | Structured ...
- Data Flow Diagram | Data Flow Diagram Software | Structured ...
- Data Flow Diagram | Structured Systems Analysis and Design ...
- Entity-relationship diagram (Crow's foot notation) | Structured ...
- System Context Diagram
- Pyramid Diagram | Process Flowchart | Structured Systems Analysis ...
- Process Flowchart | Data Flow Diagram | Structured Systems ...