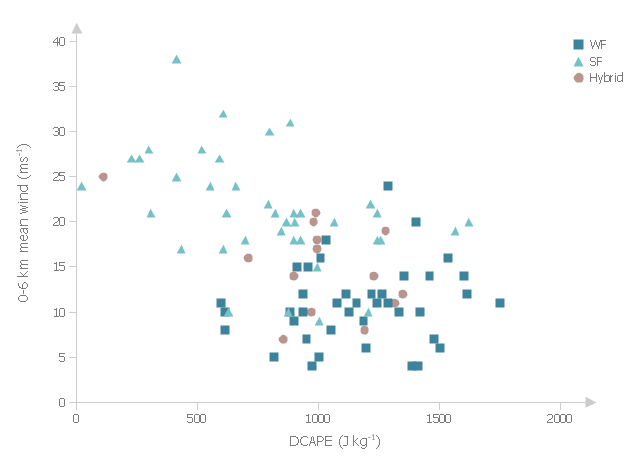
This example was drawn on the base of fig. 13 "Scatter plot of DCAPE versus 0-6 km mean wind" from the article "Examination of Derecho Environments Using Proximity Soundings" by Jeffry S. Evans on the website of Storm Prediction Center, National Oceanic and Atmospheric Administration.
"Figure 13 suggests the existence of an inverse relationship between DCAPE and mean wind when considering all derechos. Careful examination of this figure shows that this is the result of the separation into SF, WF, and hybrid categories; the SF cases are found in the upper left part of the figure, the WF cases are found in the lower right part, and the hybrid cases are in between, with some hint that they are more like the WF cases than the SF cases." [spc.noaa.gov/ publications/ evans/ bowpaper/ bowpaper.htm]
"In stratified sampling, the population is partitioned into non-overlapping groups, called strata and a sample is selected by some design within each stratum. ...
The principal reasons for using stratified random sampling rather than simple random sampling include:
1. Stratification may produce a smaller error of estimation than would be produced by a simple random sample of the same size. This result is particularly true if measurements within strata are very homogeneous.
2. The cost per observation in the survey may be reduced by stratification of the population elements into convenient groupings.
3. Estimates of population parameters may be desired for subgroups of the population. These subgroups should then be identified." [onlinecourses.science.psu.edu/ stat506/ node/ 27]
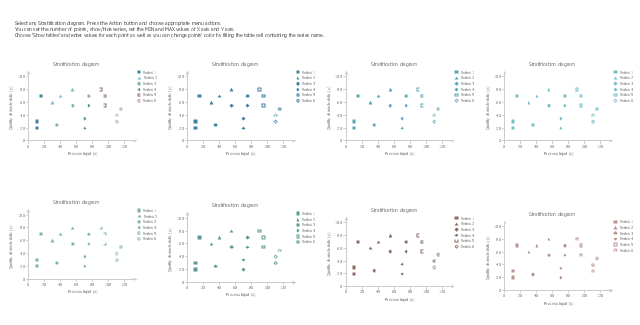
The multiserial scatterplot "Starification diagram example" was created using the ConceptDraw PRO software extended with the Seven Basic Tools of Quality solution from the Quality area of ConceptDraw Solution Park.
"Figure 13 suggests the existence of an inverse relationship between DCAPE and mean wind when considering all derechos. Careful examination of this figure shows that this is the result of the separation into SF, WF, and hybrid categories; the SF cases are found in the upper left part of the figure, the WF cases are found in the lower right part, and the hybrid cases are in between, with some hint that they are more like the WF cases than the SF cases." [spc.noaa.gov/ publications/ evans/ bowpaper/ bowpaper.htm]
"In stratified sampling, the population is partitioned into non-overlapping groups, called strata and a sample is selected by some design within each stratum. ...
The principal reasons for using stratified random sampling rather than simple random sampling include:
1. Stratification may produce a smaller error of estimation than would be produced by a simple random sample of the same size. This result is particularly true if measurements within strata are very homogeneous.
2. The cost per observation in the survey may be reduced by stratification of the population elements into convenient groupings.
3. Estimates of population parameters may be desired for subgroups of the population. These subgroups should then be identified." [onlinecourses.science.psu.edu/ stat506/ node/ 27]
The multiserial scatterplot "Starification diagram example" was created using the ConceptDraw PRO software extended with the Seven Basic Tools of Quality solution from the Quality area of ConceptDraw Solution Park.
Multiserial scatterplot
The vector stencils library "Stratification diagram" contains 8 multiseries scatterplot templates.
Use it to design your stratification diagrams with ConceptDraw PRO diagramming and vector drawing software.
"In statistics, stratified sampling is a method of sampling from a population.
In statistical surveys, when subpopulations within an overall population vary, it is advantageous to sample each subpopulation (stratum) independently. Stratification is the process of dividing members of the population into homogeneous subgroups before sampling. The strata should be mutually exclusive: every element in the population must be assigned to only one stratum. The strata should also be collectively exhaustive: no population element can be excluded. Then simple random sampling or systematic sampling is applied within each stratum. This often improves the representativeness of the sample by reducing sampling error. It can produce a weighted mean that has less variability than the arithmetic mean of a simple random sample of the population." [Stratified sampling. Wikipedia]
The stratification is one of the Seven Basic Tools of Quality. [Seven Basic Tools of Quality. Wikipedia]
The example of multiseries scatterplot templates "Design elements - Stratification diagram" is included in the Seven Basic Tools of Quality solution from the Quality area of ConceptDraw Solution Park.
Multiseries scatterplot templates
Metropolitan area networks (MAN). Computer and Network Examples
. Computer and Network Examples")

- Seven Basic Tools of Quality | Stratification diagram example ...
- Stratification diagram example
- Design elements - Stratification diagram | Stratification diagram ...
- Scatter Diagrams | Stratification diagram example | Bubble diagrams ...
- Line Chart Examples | Line Graph | Design elements - Stratification ...
- Scatter And Stratification Diagram
- Design elements - Stratification diagram | Templates Design
- Social Ecological Model (SEM) - Onion diagram | Circle-Spoke ...
- Scatter Plot | Design elements - Scatterplot | Blank Scatter Plot ...
- Basic Network Diagram | Process Flowchart | Basic Flowchart ...