 Management
This solution extends ConceptDraw PRO v9 and ConceptDraw MINDMAP v7 with Management Diagrams and Mind Maps (decision making, scheduling, thinking ideas, problem solving, business planning, company organizing, SWOT analysis, preparing and holding meetings
Diversification is a corporate strategy to increase sales volume from new products and new markets. Diversification can be expanding into a new segment of an industry that the business is already in, or investing in a promising business outside of the scope of the existing business.
Diversification is part of the four main growth strategies defined by Igor Ansoff's Product/ Market matrix.
Ansoff pointed out that a diversification strategy stands apart from the other three strategies. The first three strategies are usually pursued with the same technical, financial, and merchandising resources used for the original product line, whereas diversification usually requires a company to acquire new skills, new techniques and new facilities. [Diversification (marketing strategy). Wikipedia]
This Ansoff's Product/ Market matrix example was created using ConceptDraw PRO diagramming and vector drawing software extended with Matrices solution from Marketing area of ConceptDraw Solution Park.
Ansoff matrix

"Porter five forces analysis is a framework for industry analysis and business strategy development. It draws upon industrial organization (IO) economics to derive five forces that determine the competitive intensity and therefore attractiveness of a market. Attractiveness in this context refers to the overall industry profitability. An "unattractive" industry is one in which the combination of these five forces acts to drive down overall profitability. A very unattractive industry would be one approaching "pure competition", in which available profits for all firms are driven to normal profit.
Three of Porter's five forces refer to competition from external sources. The remainder are internal threats.
Porter referred to these forces as the micro environment, to contrast it with the more general term macro environment. They consist of those forces close to a company that affect its ability to serve its customers and make a profit. A change in any of the forces normally requires a business unit to re-assess the marketplace given the overall change in industry information. The overall industry attractiveness does not imply that every firm in the industry will return the same profitability. Firms are able to apply their core competencies, business model or network to achieve a profit above the industry average. A clear example of this is the airline industry. As an industry, profitability is low and yet individual companies, by applying unique business models, have been able to make a return in excess of the industry average.
Porter's five forces include - three forces from 'horizontal' competition: the threat of substitute products or services, the threat of established rivals, and the threat of new entrants; and two forces from 'vertical' competition: the bargaining power of suppliers and the bargaining power of customers.
This five forces analysis, is just one part of the complete Porter strategic models. The other elements are the value chain and the generic strategies." [Porter five forces analysis. Wikipedia]
The block diagram example "Porter's five forces model" was created using the ConceptDraw PRO diagramming and vector drawing software extended with the Block Diagrams solution from the area "What is a Diagram" of ConceptDraw Solution Park.
Block diagram

 PM Dashboards
This solution extends ConceptDraw PRO and ConceptDraw PROJECT software with the ability to clearly display the identified key performance indicators for any project.
"SWOT is a handy mnemonic to help corporate planners think about strategy. It stands for Strengths, Weaknesses, Opportunities and Threats. What are an organisation's SWOTs? How can it manage them in a way that will optimise its performance? A second four-letter acronym is sometimes brought into play here: USED. How can the Strengths be Used; the Weaknesses be Stopped, the Opportunities be Exploited; and the Threats be Defended against? ...
A SWOT analysis can be applied to different aspects of a company's business, such as its it capability or its skills. The simplicity and intuitive wholeness of the framework have helped to make it extremely popular with both corporations and governments." [economist.com/ node/ 14301503]
This form template "New business opportunity SWOT analysis matrix" for the ConceptDraw PRO diagramming and vector drawing software is included in the SWOT Analysis solution from the Management area of ConceptDraw Solution Park.
SWOT matrix template

ConceptDraw MINDMAP: Brainstorming, Mind Mapping for macOS and Windows

"A request for proposal (RFP) is a solicitation made, often through a bidding process, by an agency or company interested in procurement of a commodity, service or valuable asset, to potential suppliers to submit business proposals. It is submitted early in the procurement cycle, either at the preliminary study, or procurement stage. The RFP process brings structure to the procurement decision and is meant to allow the risks and benefits to be identified clearly up front.
The RFP presents preliminary requirements for the commodity or service, and may dictate to varying degrees the exact structure and format of the supplier's response. Effective RFPs typically reflect the strategy and short/ long-term business objectives, providing detailed insight upon which suppliers will be able to offer a matching perspective.
Similar requests include a request for quotation and a request for information.
In principle, an RFP:
(1) informs suppliers that an organization is looking to procure and encourages them to make their best effort.
(2) requires the company to specify what it proposes to purchase. If the requirements analysis has been prepared properly, it can be incorporated quite easily into the Request document.
(3) alerts suppliers that the selection process is competitive.
(4) allows for wide distribution and response.
(5) ensures that suppliers respond factually to the identified requirements.
(6) is generally expected to follow a structured evaluation and selection procedure, so that an organization can demonstrate impartiality - a crucial factor in public sector procurements." [Request for proposal. Wikipedia]
The PERT chart example "Request for proposal (RFP)" was created using the ConceptDraw PRO diagramming and vector drawing software extended with the solution Seven Management and Planning Tools from the Management area of ConceptDraw Solution Park.
PERT
.png--diagram-flowchart-example.png)
Legend
.png--diagram-flowchart-example.png)
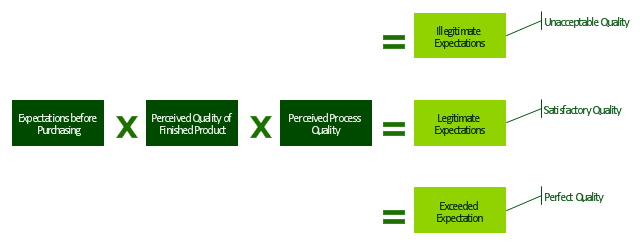
"Customer satisfaction is a term frequently used in marketing. It is a measure of how products and services supplied by a company meet or surpass customer expectation. Customer satisfaction is defined as "the number of customers, or percentage of total customers, whose reported experience with a firm, its products, or its services (ratings) exceeds specified satisfaction goals." ...
It is seen as a key performance indicator within business and is often part of a Balanced Scorecard. In a competitive marketplace where businesses compete for customers, customer satisfaction is seen as a key differentiator and increasingly has become a key element of business strategy." [Customer satisfaction. Wikipedia]
The block diagram example "Sources of customer satisfaction" was created using the ConceptDraw PRO diagramming and vector drawing software extended with the Block Diagrams solution from the area "What is a Diagram" of ConceptDraw Solution Park.
Block diagram
"The RFP presents preliminary requirements for the commodity or service, and may dictate to varying degrees the exact structure and format of the supplier's response. Effective RFPs typically reflect the strategy and short/ long-term business objectives, providing detailed insight upon which suppliers will be able to offer a matching perspective. ...
RFP:
(1) informs suppliers that an organization is looking to procure and encourages them to make their best effort.
(2) requires the company to specify what it proposes to purchase. If the requirements analysis has been prepared properly, it can be incorporated quite easily into the Request document.
(3) alerts suppliers that the selection process is competitive.
(4) allows for wide distribution and response.
(5) ensures that suppliers respond factually to the identified requirements.
(6) is generally expected to follow a structured evaluation and selection procedure, so that an organization can demonstrate impartiality - a crucial factor in public sector procurements." [Request for proposal. Wikipedia]
The project plan timeline diagram example "Request for proposal (RFP)" was created using the ConceptDraw PRO diagramming and vector drawing software extended with the Timeline Diagrams solution from the Management area of ConceptDraw Solution Park.
Project timeline
.png--diagram-flowchart-example.png)
In marketing perceptual or positioning maps are used for developing the market positioning strategy for product or service.
"Perceptual mapping is a diagrammatic technique used by asset marketers that attempts to visually display the perceptions of customers or potential customers. Typically the position of a product, product line, brand, or company is displayed relative to their competition." [Perceptual mapping. Wikipedia]
This positioning map diagram example was created using the ConceptDraw PRO diagramming and vector drawing software extended with the Matrices solution from the Marketing area of ConceptDraw Solution Park.
Perceptual map

- Competitive strategy matrix template
- SWOT Analysis Solution - Strategy Tools | Competitive strategy ...
- Build Strategies Exchanging Mind Maps with Evernote | Remote ...
- Remote Projects in Corporate Strategy | Build Strategies ...
- SWOT Analysis Solution - Strategy Tools | Mind Maps for Business ...
- Porter's generic strategies matrix diagram | Competitive strategy ...
- Remote Projects in Corporate Strategy | Pyramid Chart Examples ...
- What is SWOT Analysis in Marketing | SWOT Analysis Tool for Small ...
- How to Realize your Social Media Strategy | Build Strategies ...
- SWOT Analysis Solution - Strategy Tools | Build Strategies ...
- Remote Projects in Corporate Strategy | How to show a mind map ...
- SWOT Analysis Solution - Strategy Tools | Pyramid Chart Examples | |
- SWOT Analysis Solution - Strategy Tools | Swot Analysis Examples ...
- Competitive strategy matrix template |
- Remote Projects in Corporate Strategy | How To Implement ...
- Matrices | Mind Maps for Business - SWOT Analysis | Boston growth ...
- New business opportunity SWOT analysis matrix - Template portrait ...
- Build Strategies Exchanging Mind Maps with Evernote | How to ...
- Marketing | SWOT Analysis Solution - Strategy Tools | Pyramid Chart ...
- SWOT Analysis Solution - Strategy Tools | Positioning map ...