Cisco Products Additional. Cisco icons, shapes, stencils and symbols
")
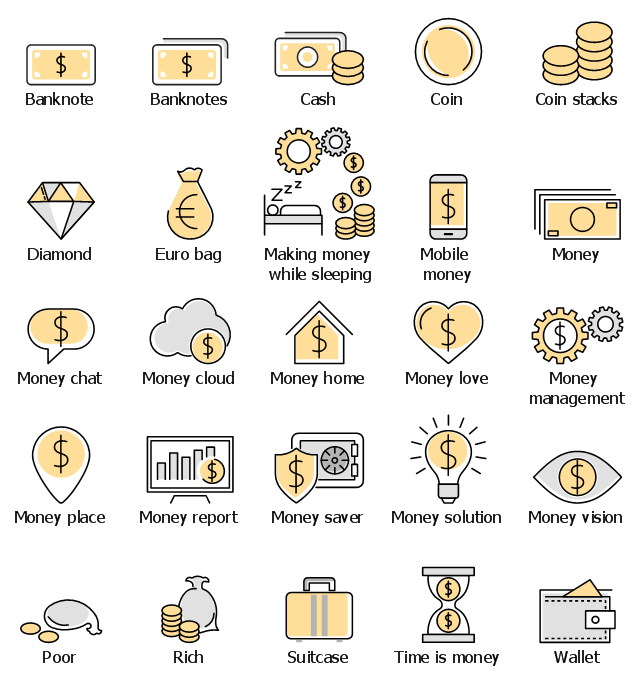
The vector stencils library "Cash" contains 25 cash and money icons.
"In economics, cash is money in the physical form of currency, such as banknotes and coins. In bookkeeping and finance, cash is current assets comprising currency or currency equivalents that can be accessed immediately or near-immediately (as in the case of money market accounts). Cash is seen either as a reserve for payments, in case of a structural or incidental negative cash flow or as a way to avoid a downturn on financial markets." [Cash. Wikipedia]
Use it to design your financial infographics.
Infographic elements
 macOS User Interface
macOS User Interface solution extends the ConceptDraw PRO functionality with powerful GUI software graphic design features and tools. It provides an extensive range of multifarious macOS Sierra user interface design examples, samples and templates, and wide variety of libraries, containing a lot of pre-designed vector objects of Mac Apps icons, buttons, dialogs, menu bars, indicators, pointers, controls, toolbars, menus, and other elements for fast and simple designing high standard user interfaces of any complexity for new macOS Sierra.
 AWS Architecture Diagrams
AWS Architecture Diagrams with powerful drawing tools and numerous predesigned Amazon icons and AWS simple icons is the best for creation the AWS Architecture Diagrams, describing the use of Amazon Web Services or Amazon Cloud Services, their application for development and implementation the systems running on the AWS infrastructure. The multifarious samples give you the good understanding of AWS platform, its structure, services, resources and features, wide opportunities, advantages and benefits from their use; solution’s templates are essential and helpful when designing, description and implementing the AWS infrastructure-based systems. Use them in technical documentation, advertising and marketing materials, in specifications, presentation slides, whitepapers, datasheets, posters, etc.
Flowchart Software

 Business Diagrams Package
Business Diagrams Package is a large set of comprehensive graphical solutions from the ConceptDraw Solution Park, which are powerful in solving the business, marketing and quality tasks in completely different fields, such as finance, education, health food and cooking, HR, and many others. The tools of this package's solutions are a powerful assistant in drawing all diversity of Financial and Marketing infographics, Business process workflow diagrams, Organizational charts, Education infographics, Quality diagrams, Health food diagrams, HR flowcharts, as well as different graphics and charts, which depict the values of key business indicators, their dependencies, give the full understanding of a situation within a company and on the market.
- Pound Icon Png
- Cloud clipart - Vector stencils library | How to Simplify Flow Charting ...
- Design elements - Cloud round icons | Design elements - IVR ...
- Finance - Vector stencils library | Currency - Vector stencils library ...
- Business Growth Icon Png
- Shopping Cart Vector Icon Png
- Sales symbols - Vector stencils library | Currency - Vector stencils ...
- How are Summary Values of Project Phases Calculated | PDCA ...
- Currency - Vector stencils library | Business people pictograms ...
- Shopping pictograms - Vector stencils library | Shopping pictograms ...