The vector stencils library "Soccer (Football) positions" contains 18 symbols for drawing association football (soccer) positions diagram.
"In the sport of association football, each of the eleven players on a team is assigned to a particular position on the field of play. A team is made up of one goalkeeper and ten outfield players who fill various defensive, midfield and attacking positions depending on the formation deployed. These positions describe both the player's main role and their area of operation on the pitch." [Association football positions. Wikipedia]
The symbols example "Design elements - Soccer (Football) positions" was created using the ConceptDraw PRO diagramming and vector drawing software extended with the Soccer solution from the Sport area of ConceptDraw Solution Park.
www.conceptdraw.com/ solution-park/ sport-soccer
HelpDesk
How to Make Soccer Position Diagram Using ConceptDraw PRO
The soccer field has the form of a large rectangle, covered with grass. Dimensions of soccer fields may vary slightly, depending on the level of the game, but all fields have some common characteristics. Soccer players may take different positions. Each soccer position has its own name, and implies certain player functions. Every soccer position has a very specific name and task: Goalkeeper, Defenders, Midfielders and Forwards. During preparation for the game coach met a challenge: how to explain each player's position and his role in the game. The difficulty is the fact that in the course of the game players will often move on the field and do not stay in one place. Football field diagram with dimensions and marking, and positions - it is an important tool for the coach. ConceptDraw PRO helps both coach and players to understand exactly their roles during the particular game. The ability to create Soccer diagrams is contained in the ConceptDraw Soccer solution. The solution provides
 ConceptDraw Solution Park
ConceptDraw Solution Park collects graphic extensions, examples and learning materials
HelpDesk
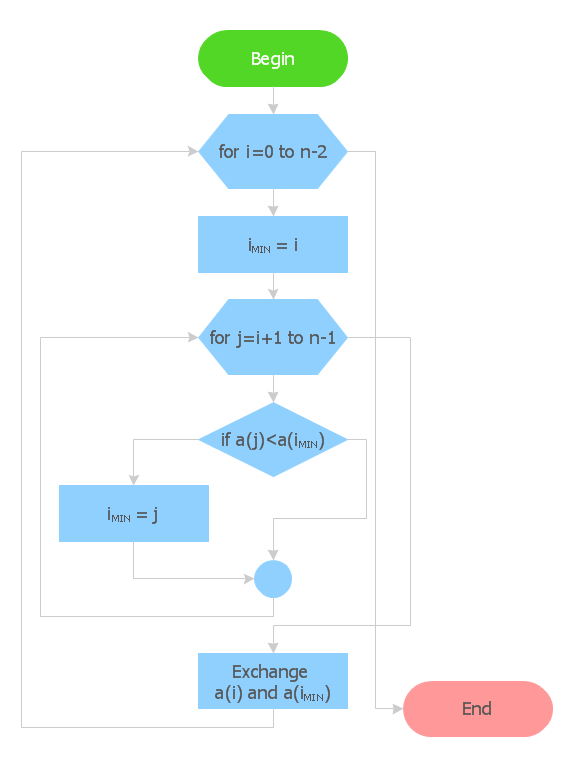
How to Create Flowchart Using Standard Flowchart Symbols
Flowcharts are used to display an algorithm for consistent execution of certain steps. Flowchart is probably the easiest way to make a graphical representation of any process. Flowcharts use the set of standard geometric symbols and arrows to define relationships. ConceptDraw PRO allows you to create professional flowchart quickly and easily. The ability to create flowcharts is contained in the Flowcharts solution. The solution provides a set of special tools for creating flowcharts.HelpDesk
Accounting Information Systems Flowchart Symbols
Accounting Information system is a combination of software and hardware, as well as organizational support. Information system - it is not only the software and computers with network equipment, but also a list of instructions and standards which can be notated using Accounting information systems flowchart symbols. All information systems can be divided into information retrieval and data processing systems. Data Flow model is a hierarchical model. Each process can be divided into structural components, that depict by corresponding flowchart symbols, showing the accounting information system in communication with the external environment. The major components of accounting information systems flowchart are: entities, processes, data stores, and data flows. The set of standard accounting information flowchart symbols is intended to show the relationships between the system components. ConceptDraw PRO can help to draw clear accounting information system diagrams using special flowchart symbols.HelpDesk
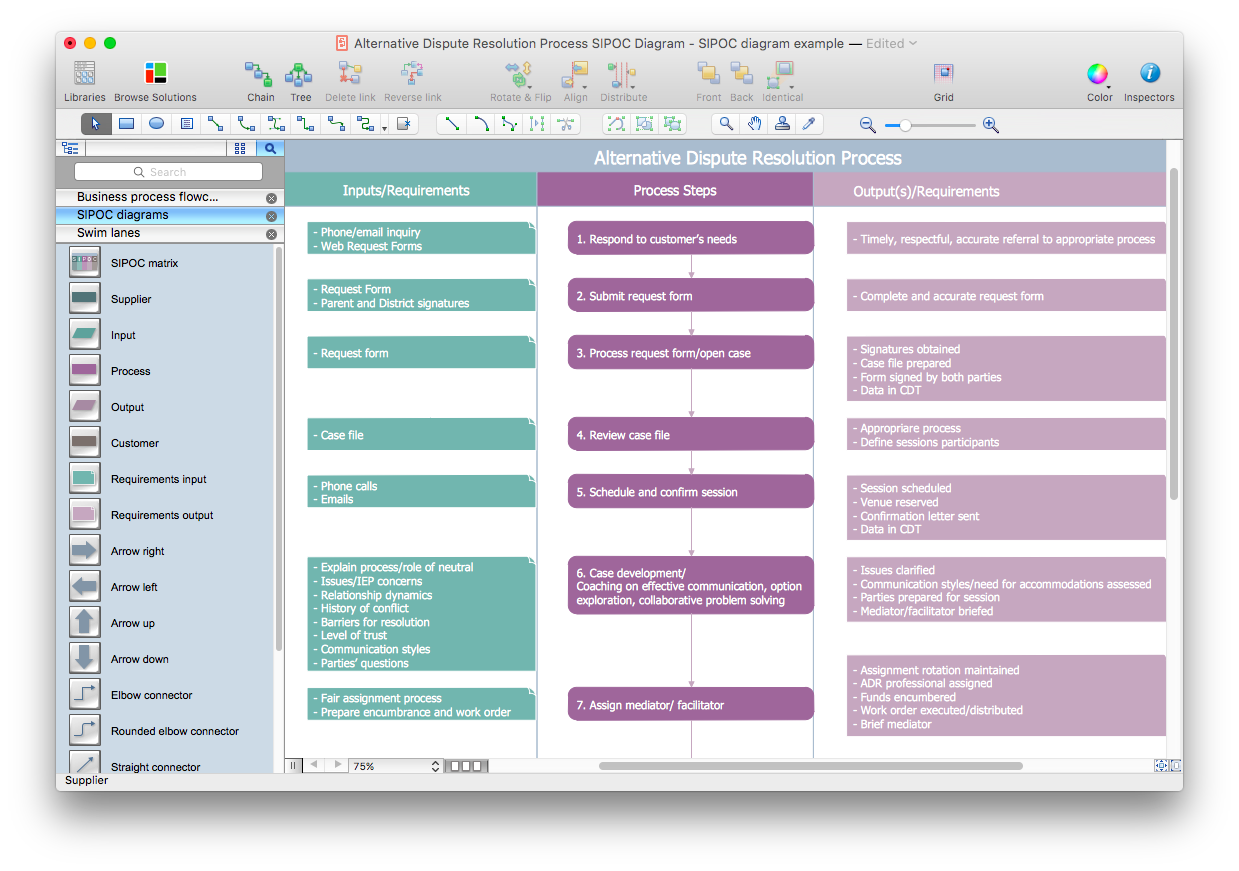
How to Create a SIPOC Diagram Using ConceptDraw PRO
SIPOC (suppliers, inputs, process, outputs, customers) diagram is focused on the quality of a business process inputs and outputs. SIPOC diagram has a form of a segmented table that gives comprehensive outline for each category. SIPOC diagram depicts the start and end of a process, and the relationships between a company and its suppliers. SIPOC diagram is an important part of the Six Sigma methodology. With its Business Process Mapping solution, ConceptDraw PRO offers a power set of process mapping tools to empower quality management within an organization.HelpDesk
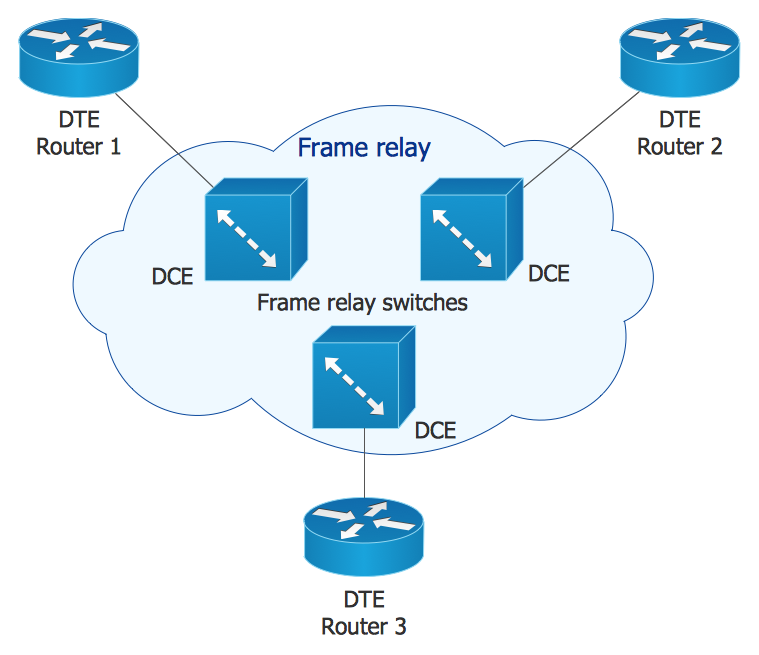
How to Create Cisco Network Diagram Using ConceptDraw Libraries
Cisco Network chart can be a great start for detailed network documentation, as well as serve as a visual instruction for new IT staff, or as a detailed illustration for a presentation. The easiest way to design Cisco Network diagram using standard Cisco product symbols is using ConceptDraw PRO powered by Cisco Network Diagrams solution. The Cisco Network Diagrams solution uses Cisco network symbols and icons to to visually document the Cisco network topology and design of Cisco network diagrams. Using ConceptDraw libraries you can access a wide array of Cisco network icons, so you can quickly prototype a new network or document an existing one.HelpDesk
How to Add a Self-Drawn Object to any Library
One of the key elements of ConceptDraw PRO solutions are the libraries, containing a set of associated objects. Using these collections of business oriented vector objects, you can quickly get started making the diagram in the theme you need. The library collection can be supplemented by creating new or editing existing objects. You can create your own unique library just by dragging objects with the mouse. Library objects can be customized and saved for later use. You can change the scaling, color, line weight, label, and even the fill pattern of an object to use in custom drawings and diagrams. Your custom objects even can be searched for the next time you need to use them.HelpDesk
How to Create a Fishbone (Ishikawa) Diagram Quickly
A Fishbone (Ishikawa) diagram is also called cause-and-effect diagram. Fishbone diagram is often used in business to determine the cause of some problem. The diagram illustrates the main causes and sub-causes leading to an event. The main goal of the Fishbone diagram is to illustrate in a graphical way the relationship between a given outcome and all the factors that influence this outcome. The complete diagram resembles a fish skeleton as its name implies. The ability to create a Fishbone Diagram is supported by the Fishbone Diagram solution. Use ConceptDraw MINDMAP for structuring data and then ConceptDraw PRO for generating a Fishbone Diagram from mind map structure.HelpDesk
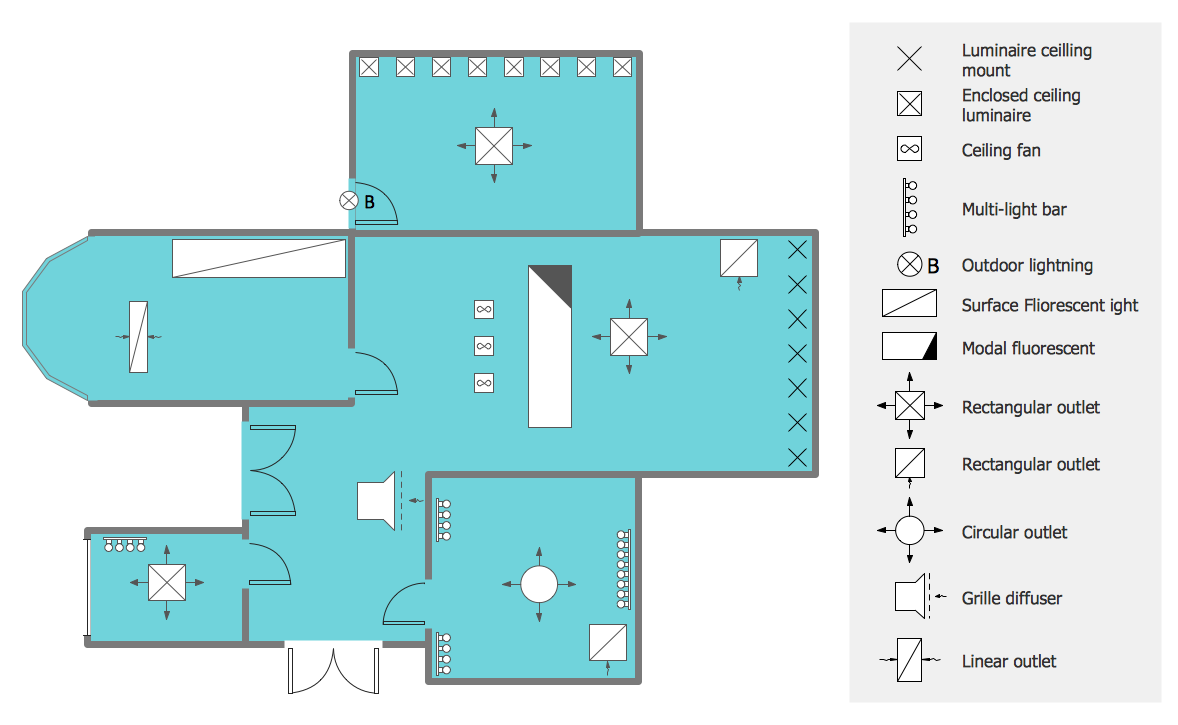
How to Create a Reflected Ceiling Floor Plan
A Reflected Ceiling Plan (RCP) is a drawing of a room or building, looking down at the interior ceiling. Making RCP involves many different reflected ceiling plan symbols that can be managed using ConceptDraw PRO. Using ConceptDraw PRO you can design the reflected ceiling floor plan that shows the location of light fixtures and any other items that may be suspended from the ceiling. You can share your ceiling design ideas by saving drawings as graphics files, or printing them.- Soccer Football Position Symbols
- Soccer (Football) Positions | Soccer (Football) Diagram Software ...
- Association football ( soccer ) positions | How to Make Soccer ...
- Positions In Soccer Symbols
- Soccer (Football) Formation | Network Topologies | Basic Flowchart ...
- Symbol Position Football
- A Sketch Of A Football Pitch And Formation Of Players From Number
- Design elements - Soccer (Football) positions | Design elements ...
- Design elements - Football positions | Soccer (Football) Formation ...
- Soccer (Football) Positions | Offensive Play – Double Wing Wedge ...
- Basic Flowchart Symbols and Meaning | F&B | Soccer | Diagrams Of ...
- Design a Soccer (Football) Field | Soccer (Football) Dimensions ...
- Football | Soccer (Football) Diagram Software | Design a Soccer ...
- Soccer (Football) Positions
- Design elements - Football positions (for perspective view) | 3-4 ...
- IDEF0 standard with ConceptDraw PRO | PM Response | Soccer ...
- Create Soccer (Football) Positions | Soccer (Football) Positions ...
- Association football ( soccer ) positions | Design elements - Football ...
- Drawing Of A Soccer Pitch And Its Positions
- Sample Of Soccer Draw
-position-symbols-design-elements---soccer-(football)-positions.png--diagram-flowchart-example.png)

