How to Simplify Flow Charting — Cross-functional Flowchart
In ConceptDraw PRO it really is sp simple to draw even the most complex cross-functional flowcharts. Use the RapidDraw technology and Cross-Functional libraries in ConceptDraw PRO for the best results.Cross-Functional Flowchart
Use of Cross-Functional Flowchart is a clear way of showing each team member’s responsibilities and how processes get shared or transferred between different responsible people, teams and departments. Use the best flowchart maker ConceptDraw PRO with a range of standardized cross-functional flowchart symbols to create the Cross-Functional Flowcharts simply and to visualize the relationship between a business process and the functional units responsible for that process. To draw the most quickly Cross-Functional Flowcharts, Cross Functional Process Maps, or Cross Functional Process Flow Diagrams, start with a Cross-functional flowchart samples and templates from ConceptDraw Solution Park. The ConceptDraw Arrows10 and RapidDraw technologies will be also useful for you in drawing. ConceptDraw PRO supports designing both types - horizontal and vertical Cross-functional flowcharts. A vertical layout makes the accents mainly on the functional units while a horizontal layout - on the process. If you need a Visio alternative in Mac OS X, try ConceptDraw PRO. Its interface is very intuitive and it’s actually much easier to use than Visio, yet somehow it’s just as powerful if not more so. ConceptDraw PRO performs professional quality work and seamless Visio interaction.
BPR Diagram. Business Process Reengineering Example
This sample was created in ConceptDraw PRO diagramming and vector drawing software using the Business Process Diagram Solution from the Business Processes area of ConceptDraw Solution Park. The Business Process Solution is based on the standard BPMN 2.0 and includes the set of libraries of ready-to-use objects.Onion Diagram Maker
The onion diagram is a type of diagram which shows the dependencies among parts of an organization or process. The items are displayed at the concentric circles, where the items at the bigger rings depend on the items at the smaller rings. ConceptDraw PRO diagramming and vector drawing software extended with Stakeholder Onion Diagrams Solution from the Management Area of ConceptDraw Solution Park is a professional Onion Diagram Maker.Quality Control Chart Software — ISO Flowcharting
Quality Control Chart Software (ISO Flowcharting) - ConceptDraw PRO extended with Total Quality Management TQM Diagrams Solution from the Quality Management Area is the best diagramming and vector drawing software that allows you to draw the quality control charts quick and easy. The quality control chart is a graphic that illustrates the accordance of processes or products to the intended specifications and degree of differences from them. Depending on what type of data you need analyze, there are used different types of quality control charts: X-bar charts, S charts, Np charts.How To use House Plan Software
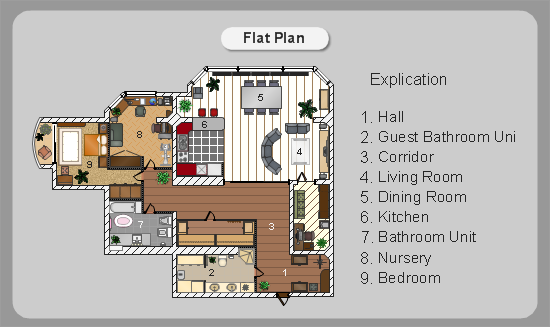
House Plan Software — Create house blueprints or a construction drawing. This example is created using ConceptDraw PRO diagramming software enhanced with solution Building Plans from ConceptDraw Solution Park.
Garrett IA Diagrams with ConceptDraw PRO
Garrett IA diagrams are used at development of Internet-resources, in particulars at projecting of interactions of web-resource elements. The diagram of information architecture of the web resource which is constructed correctly with necessary details presents to developers the resource in comprehensible and visual way.- Work Simplification Flowchart
- Industrial Management Work Simplification Process And Flow Chart
- How to Simplify Flow Charting — Cross-functional Flowchart ...
- Flow chart Example. Warehouse Flowchart | Design elements ...
- Basic Flowchart Symbols and Meaning | Cross-Functional Flowchart ...
- Cross-Functional Flowchart | Garrett IA Diagrams with ConceptDraw ...
- Process Flowchart | Work Flow Process Chart | Basic Flowchart ...
- Basic Flowchart Symbols and Meaning | Work Flow Process Chart ...
- Process Flowchart | Basic Flowchart Symbols and Meaning | Flow ...
- How to Simplify Flow Charting — Cross-functional Flowchart | Cross ...
- Process Flowchart | Basic Flowchart Symbols and Meaning ...
- Process Flow Diagram Symbols | Process Flowchart | How to Draw a ...
- Process Flowchart | Flow chart Example. Warehouse Flowchart ...
- Process Flowchart | Types of Flowcharts | LLNL Flow Charts ...
- Process Flowchart | TQM Diagram Example | Process Flow Chart ...
- Process Flowchart | Idustrial Management Diagram
- Process Flowchart | TQM Diagram Example | Process Flow Chart ...
- Basic Flowchart Symbols and Meaning | Business Diagram Software ...
- Process Flowchart | Chemical Engineering | Plant Layout Plans ...
- Process Flowchart | Total Quality Management Value | Definition ...


