HelpDesk
How to Create an ERD Diagram
ERD (entity relationship diagram) is used to show the logical structure of databases. It represents the interrelationships between components of database (entities). Entity relationship diagrams are a widely used in software engineering. Using ERD software engineers can control the every aspect of database development. ER diagram can be used as guide for testing and communicating before the release of software product. ERD displays data as entities that are connected with connections that show the relationships between entities. There is some ERD notations used by data bases developers for representing the relationships between the data objects. ConceptDraw PRO and its ERD solution allow you to build ERD diagram of any notation.IDEF9 Standard
Use Case Diagrams technology. An effective management of changes is significantly facilitated by way of definition and documenting of business-requirements.
 Entity-Relationship Diagram (ERD)
An Entity-Relationship Diagram (ERD) is a visual presentation of entities and relationships. That type of diagrams is often used in the semi-structured or unstructured data in databases and information systems. At first glance ERD is similar to a flowch
 Vehicular Networking
Network engineering is an extensive area with wide range of applications. Depending to the field of application, network engineers design and realize small networks or complex networks, which cover wide territories. In latter case will be ideal recourse to specialized drawing software, such as ConceptDraw PRO.
HelpDesk
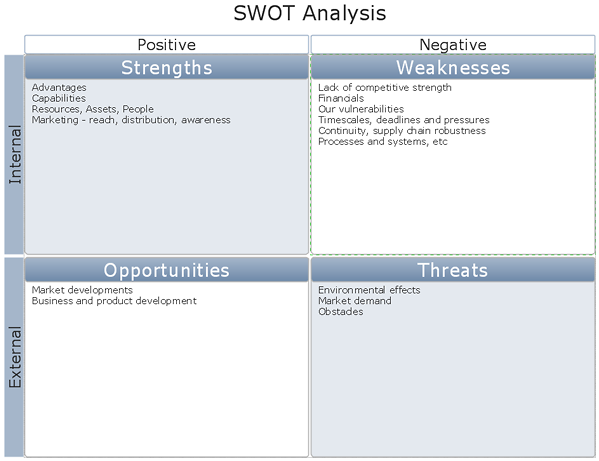
How to Create a SWOT Matrix Quickly
ConceptDraw PRO allow create SWOT Matrix in just one click for presenting analysis results preformed in mimd map structure using ConceptDraw MINDMAP.
 Venn Diagrams
Venn Diagrams are actively used to illustrate simple set relationships in set theory and probability theory, logic and statistics, mathematics and computer science, linguistics, sociology, and marketing. Venn Diagrams are also often used to visually summarize the status and future viability of a project.
Is ConceptDraw PRO an Alternative to Microsoft Visio?
Visio for Mac and Windows - ConceptDraw as an alternative to MS Visio. ConceptDraw PRO delivers full-functioned alternative to MS Visio. ConceptDraw PRO supports import of Visio files. ConceptDraw PRO supports flowcharting, swimlane, orgchart, project chart, mind map, decision tree, cause and effect, charts and graphs, and many other diagram types.
 Ice Hockey
The Ice Hockey Solution extends the capabilities of ConceptDraw PRO v9.5 (or later) with samples, templates, and libraries of vector objects for drawing hockey diagrams, plays schemas, and illustrations. The Ice Hockey Solution can be used to make polishe
- Engineering Drawing Importance In Chemical Engineering
- Scientific Symbols Chart | Basic Flowchart Symbols and Meaning ...
- Basic Flowchart Symbols and Meaning | Process Flowchart | Types ...
- Process Flowchart | Piping and instrumentation diagram template ...
- Basic Flowchart Symbols and Meaning | Process Flowchart | Basic ...
- Basic Flowchart Symbols and Meaning | Flow chart Example ...
- Colored baseball field | Business Processes Area | Electrical ...
- Basic Flowchart Symbols and Meaning | Audit Flowchart Symbols ...
- Bio Flowchart | Bio Flowchart Lite | Process Flowchart | Charts On ...
- Design Pictorial Infographics. Design Infographics | ConceptDraw ...
- Basic Flowchart Symbols and Meaning | Business Process ...
- Basic Flowchart Symbols and Meaning | Network Diagram Software ...
- Engineering | Process Flowchart | Universal Diagramming Area ...
- Block diagram - Automotive HVAC system | Create Block Diagram ...
- Design Pictorial Infographics. Design Infographics | Aerospace and ...
- Flow chart Example. Warehouse Flowchart | Design Pictorial ...
- Process Flowchart | Basic Flowchart Symbols and Meaning | Contoh ...
- Process Flowchart | Chemical and Process Engineering | Process ...
- Design Pictorial Infographics. Design Infographics | Continent Maps ...
- Rapid UML | UML Use Case Diagram Example Registration System ...


