Settlement Process Flowchart. Flowchart Examples

Purchasing Flow Chart. Purchasing Flowchart Example

Account FlowchartFlowchart Examples

Use the Best FlowChart Tool for the Job

Business and Finance Illustrations

UML Diagram for System

Risk Diagram (Process Decision Program Chart)
 *")
 Data Flow Diagrams (DFD)
The use of Data Flow Diagrams (DFD) solution as an extension to the ConceptDraw DIAGRAM tool can simplify its users’ work by creating any necessary Data Flow Diagram, which can help simulate multiple data flows and illustrate the functional requirements of the system or business process. Using the pre-made templates and samples of the DFDs, and as the stencil libraries full of DFD-related design elements, any ConceptDraw DIAGRAM user might find the Data Flow Diagrams (DFD) solution a useful tool for making the needed DFD drawings.
UML Collaboration Diagram Example Illustration

Business Process Modeling Software for Mac

 Sales Flowcharts
The Sales Flowcharts solution lets you create and display sales process maps, sales process workflows, sales steps, the sales process, and anything else involving sales process management.
Sales Process Flowchart Symbols

Sales Process Management

It is effective to use professional software for the sales process management. ConceptDraw DIAGRAM diagramming and vector drawing software extended with Sales Flowcharts solution from the Marketing area of ConceptDraw Solution Park is the best choice.
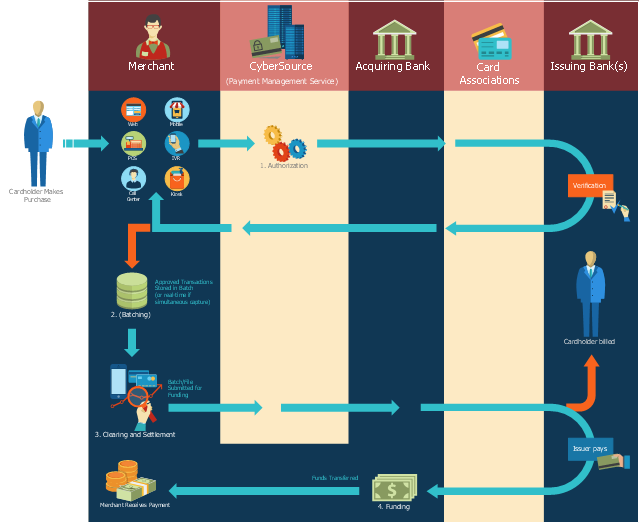
This payment process flowchart example was created on the base of the diagram of payment process using Global Payment Processing Services from the U.S. Securities and Exchange Commission website.
"Global Payment Processing Services. CyberSource Advanced enables merchants to accept payments made by all major credit and debit cards including American Express®, Discover®, Diners Club International®, JCB, MasterCard®, and Visa® cards. Our customers can also accept payment by corporate procurement cards, electronic checks, PayPal® Express Checkout, and the Bill Me Later® service. Merchants that have business models based on subscriptions can utilize the CyberSource recurring billing service with automated account updating services. For merchants selling internationally, we support direct debit, and bank transfers, as well as regional card brands such as Carte Bleue, Carta Si, Dankort, Laser, Solo, and Visa Electron. We provide these services for online, call center, kiosk, integrated voice response (“IVR”), and IP-enabled point of sale (“POS”) transactions."
[www.sec.gov/ Archives/ edgar/ data/ 934280/ 000119312510042764/ d10k.htm]
The flowchart example "Global Payment Solutions" was created using the ConceptDraw PRO diagramming and vector drawing software extended with the Sales Flowcharts solution from the Marketing area of ConceptDraw Solution Park.
Payment process flowchart
Troubleshooting in Wireless Connection

Product Proposal Template

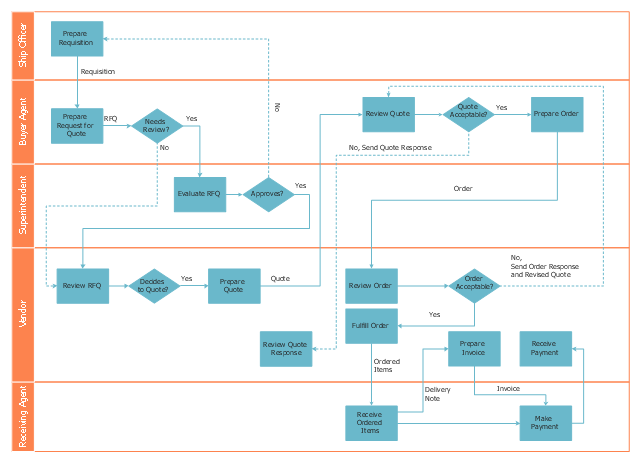
This deployment flow chart sample shows the trading process flow.
"Trade, also called goods exchange economy, is to transfer the ownership of goods from one person or entity to another by getting something in exchange from the buyer. Trade is sometimes loosely called commerce or financial transaction or barter. A network that allows trade is called a market. ...
Modern traders ... generally negotiate through a medium of exchange, such as money. As a result, buying can be separated from selling, or earning. ...
Retail trade consists of the sale of goods or merchandise from a very fixed location, such as a department store, boutique or kiosk, or by mail, in small or individual lots for direct consumption by the purchaser. Wholesale trade is defined as the sale of goods that are sold merchandise to retailers, to industrial, commercial, institutional, or other professional business users, or to other wholesalers and related subordinated services." [Trade. Wikipedia]
The swim lane diagram example "Deployment flowchart - Trading process diagram" was created using the ConceptDraw PRO diagramming and vector drawing software extended with the Cross-Functional Flowcharts solution from the Business Processes area of ConceptDraw Solution Park.
Swim lane diagram
 Organizational Charts
Organizational Charts solution extends ConceptDraw DIAGRAM software with samples, templates and library of vector stencils for drawing the org charts.
- Audit Flowcharts | Accounting Flowchart : Purchasing, Receiving ...
- Settlement Process Flowchart . Flowchart Examples | Why Flowchart ...
- Settlement Process Flowchart . Flowchart Examples | Accounting ...
- Types of Flowchart - Overview | Settlement Process Flowchart ...
- Logistics Flow Charts | Settlement Process Flowchart . Flowchart ...
- Flow chart Example. Warehouse Flowchart | Settlement Process ...
- Settlement Process Flowchart . Flowchart Examples | Horizontal ...
- Types of Flowchart - Overview | Settlement Process Flowchart ...
- Accounting Flowchart Purchasing Receiving Payable and Payment ...
- Process flowchart - Trading process | Settlement Process Flowchart ...