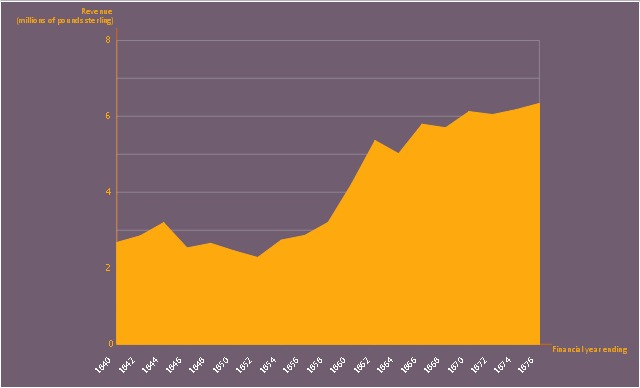
This area chart sample shows the revenue collected by the East India Company (after 1858 the British government) from salt (including inland and port taxes and sale of government salt). It was designed on the base of the Wikimedia Commons file: British India salt revenue 1840-1877.png.
[commons.wikimedia.org/ wiki/ File:British_ India_ salt_ revenue_ 1840-1877.png]
This file is licensed under the Creative Commons Attribution-Share Alike 3.0 Unported license. [creativecommons.org/ licenses/ by-sa/ 3.0/ deed.en]
"The Inland Customs Line which incorporated the Great Hedge of India (or Indian Salt Hedge[1]) was a customs barrier built by the British across India primarily to collect the salt tax. The customs line was begun while India was under the control of the East India Company but continued into the period of direct British rule. The line had its beginnings in a series of customs houses that were established in Bengal in 1803 to prevent the smuggling of salt to avoid the tax. These customs houses were eventually formed into a continuous barrier that was brought under the control of the Inland Customs Department in 1843." [Inland Customs Line. Wikipedia]
The area graph example "British India salt revenue 1840-1877" was created using the ConceptDraw PRO diagramming and vector drawing software extended with the Area Charts solution from the Graphs and Charts area of ConceptDraw Solution Park.
Area chart
 Meter Dashboard
Meter dashboard solution extends ConceptDraw PRO software with templates, samples and vector stencils library with meter indicators for drawing visual dashboards showing quantitative data.
 Entity-Relationship Diagram (ERD)
Entity-Relationship Diagram (ERD) solution extends ConceptDraw PRO software with templates, samples and libraries of vector stencils from drawing the ER-diagrams by Chen's and crow’s foot notations.
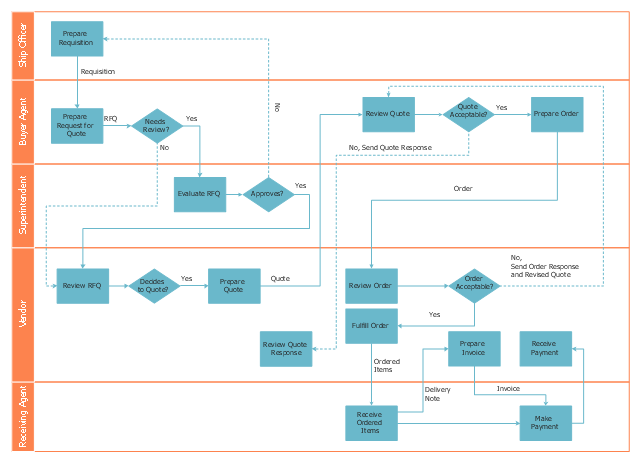
"Trade, also called goods exchange economy, is to transfer the ownership of goods from one person or entity to another by getting something in exchange from the buyer. Trade is sometimes loosely called commerce or financial transaction or barter. A network that allows trade is called a market. ...
Modern traders ... generally negotiate through a medium of exchange, such as money. As a result, buying can be separated from selling, or earning. ...
Retail trade consists of the sale of goods or merchandise from a very fixed location, such as a department store, boutique or kiosk, or by mail, in small or individual lots for direct consumption by the purchaser. Wholesale trade is defined as the sale of goods that are sold merchandise to retailers, to industrial, commercial, institutional, or other professional business users, or to other wholesalers and related subordinated services." [Trade. Wikipedia]
The deployment flow chart example "Trading process diagram" was created using the ConceptDraw PRO diagramming and vector drawing software extended with the Cross-Functional Flowcharts solution from the Business Processes area of ConceptDraw Solution Park.
Deployment flowchart
- Which Graph Does Not Work For Showing Sale Of A Company
- Business Graphs Examples
- A Bar Graph Showing Sales Of A Business
- Sample Of Sales Of Chart
- Sales Process Flow Chart
- Sales Growth. Bar Graphs Example | Bar Chart Examples | Column ...
- Sales Growth. Bar Graphs Example | Sales Dashboards for Your ...
- Company Sales Graph
- Sales Growth. Bar Graphs Example
- Business Sales Bar Graph
- Sales And Marketing Process Flow Chart
- Examples of Flowcharts, Org Charts and More | Organizational Chart ...
- Flowchart Marketing Process. Flowchart Examples | Marketing Flow ...
- Flow Chart Creator | Trading process diagram - Deployment ...
- Business Marketing Bar Chart
- Marketing Flow Chart
- Pyramid Chart Examples | Service-goods continuum diagram ...
- A Business Bar Graph
- Example Of Pictorial Chart And Diagram Showing The Sales Of Apple
- Process Flowchart | Basic Flowchart Symbols and Meaning | Types ...