"In software engineering, software system safety optimizes system safety in the design, development, use, and maintenance of software systems and their integration with safety-critical hardware systems in an operational environment." [Software system safety. Wikipedia]
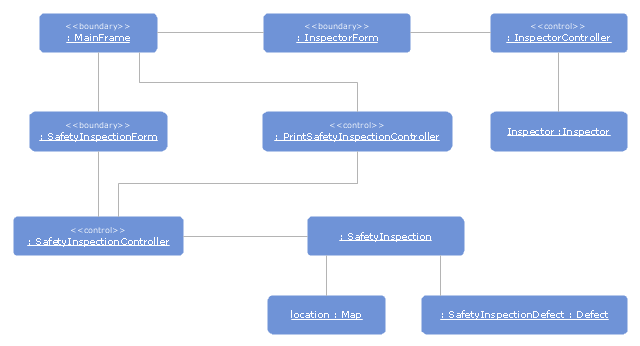
The UML object diagram example "Safety inspection" was created using the ConceptDraw PRO diagramming and vector drawing software extended with the Rapid UML solution from the Software Development area of ConceptDraw Solution Park.
The UML object diagram example "Safety inspection" was created using the ConceptDraw PRO diagramming and vector drawing software extended with the Rapid UML solution from the Software Development area of ConceptDraw Solution Park.
UML object diagram
Program Evaluation and Review Technique (PERT) with ConceptDraw DIAGRAM

Campus Area Networks (CAN). Computer and Network Examples


Easy Flowchart Program and Standard Flowchart Symbols

 Note Exchange
This solution extends ConceptDraw MINDMAP software with the ability to exchange with Evernote, and access mind maps anywhere, on any computer or mobile device via Evernote.
"A piping and instrumentation diagram/ drawing (P&ID) is a diagram in the process industry which shows the piping of the process flow together with the installed equipment and instrumentation. ...
P&IDs play a significant role in the maintenance and modification of the process that it describes. It is critical to demonstrate the physical sequence of equipment and systems, as well as how these systems connect. During the design stage, the diagram also provides the basis for the development of system control schemes, allowing for further safety and operational investigations, such as a Hazard Analysis and Operability Study...
For processing facilities, it is a pictorial representation of:
Key piping and instrument details,
Control and shutdown schemes,
Safety and regulatory requirements,
Basic start up and operational information." [Piping and instrumentation diagram. Wikipedia]
The piping and instrumentation diagram template for the ConceptDraw PRO diagramming and vector drawing software is included in the Chemical and Process Engineering solution from the Engineering area of ConceptDraw Solution Park.
Piping and instrumentation diagram / drawing (P&ID)
-piping-and-instrumentation-diagram-template.png--diagram-flowchart-example.png)
Human Resource Development

 Quality Mind Map
This solution extends ConceptDraw MINDMAP software with Quality Management Mind Maps (Presentations, Meeting Agendas, Problem to be solved).
 Status Dashboard
Status dashboard solution extends ConceptDraw DIAGRAM software with templates, samples and vector stencils libraries with graphic indicators for drawing the visual dashboards showing status data.
The FTA diagram sample "Fault tree analysis - Insulin delivery system" was redesigned from the illustration of "CMSI 641: Introduction to Software Engineering. Design of Critical Systems. B.J. Johnson. 2005. Loyola Marymount University".
"Another way of assessing hazards is using fault tree analysis. In this process, each of the identified hazards is covered by a detailed analysis to find out what might cause it. Either inductive or deductive reasoning is applied. In the case of software hazards, the usual focus is to determine faults that will cause the system to fail to deliver a system service, such as a monitoring system. A "fault tree" is constructed to link all the possible situations together, to help identify the interrelationships of the failures, which modules may cause them, and what "trickle-down effects" there might be. Here is an example of a fault tree, as applied to the Insulin delivery system from Sommerville...
Note that this tree is only partially complete, since only the potential software faults are shown on the diagram. The potential failures involving hardware, such as low battery, blood monitor or sensor failure, patient over-exertion or inattention, or medical staff failure are noticeable by their absence.
The fault tree and safety specification processes are two ways of helping with system risk assessment tasks. Once the risks are identified, there are other assessments that need to take place. First, the likelihood of the risk occurrance must be assessed. This is often quantifiable, so numbers may be assigned based on things like MTBF, latency effects, and other known entities. There may be other non-quantifiable contributors to the risk likelihood, however, such that these must be assessed and estimated by experts in the domain. (Don't short-change this process when dealing with critical systems!) Finally, the risk assessment must include the severity of the risk, meaning an estimation of the cost to the project in the event the risk item actually does occur. "Cost to the project" means all associated costs, including schedule delays, human injury, damage to hardware, corruption of data, and so on."
[myweb.lmu.edu/ bjohnson/ cmsi641web/ week15-2.html]
The FTA diagram example "Fault tree analysis - Insulin delivery system" was created using the ConceptDraw PRO diagramming and vector drawing software extended with the Fault Tree Analysis Diagrams solution from the Engineering area of ConceptDraw Solution Park.
FTA diagram

- UML object diagram - Safety inspection | Software Development ...
- Safety Critical Tasks
- UML object diagram - Safety inspection | Design elements - UML ...
- UML object diagram - Safety inspection | UML object diagram ...
- UML object diagram - Safety inspection | Uml Object Diagram
- UML object diagram - Safety inspection | Rapid UML | UML activity ...
- Patients Safety Tree Diagram
- Safety Risk Analysis
- Safety Equipments In Instrumentation
- FTA diagram - Hazard analysis | Accident analytic tree - FTA ...