 ConceptDraw Solution Park
ConceptDraw Solution Park collects graphic extensions, examples and learning materials
 Fault Tree Analysis Diagrams
This solution extends ConceptDraw DIAGRAM.5 or later with templates, fault tree analysis example, samples and a library of vector design elements for drawing FTA diagrams (or negative analytical trees), cause and effect diagrams and fault tree diagrams.
 Cafe and Restaurant Floor Plans
Restaurants and cafes are popular places for recreation, relaxation, and are the scene for many impressions and memories, so their construction and design requires special attention. Restaurants must to be projected and constructed to be comfortable and e
Bubble diagrams in Landscape Design with ConceptDraw DIAGRAM

 SWOT and TOWS Matrix Diagrams
SWOT and TOWS Matrix Diagrams solution extends ConceptDraw DIAGRAM and ConceptDraw MINDMAP software with features, templates, samples and libraries of vector stencils for drawing SWOT and TOWS analysis matrices and mind maps.
 Event-driven Process Chain Diagrams
Event-Driven Process Chain Diagrams solution extends ConceptDraw DIAGRAM functionality with event driven process chain templates, samples of EPC engineering and modeling the business processes, and a vector shape library for drawing the EPC diagrams and EPC flowcharts of any complexity. It is one of EPC IT solutions that assist the marketing experts, business specialists, engineers, educators and researchers in resources planning and improving the business processes using the EPC flowchart or EPC diagram. Use the EPC solutions tools to construct the chain of events and functions, to illustrate the structure of a business process control flow, to describe people and tasks for execution the business processes, to identify the inefficient businesses processes and measures required to make them efficient.
HelpDesk
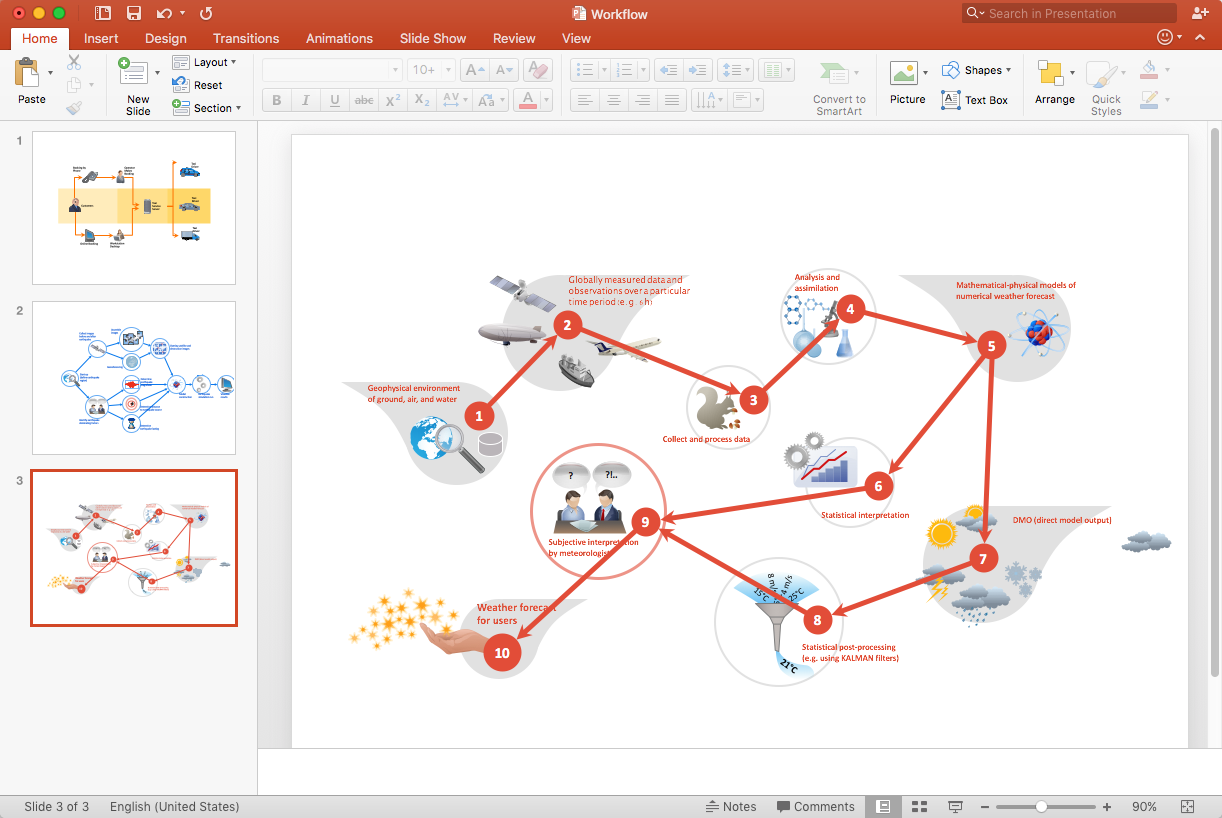
How to Add a Workflow Diagram to a PowerPoint Presentation
HelpDesk
How to Create SWOT Analysis Template

 Fishbone Diagrams
The Fishbone Diagrams solution extends ConceptDraw DIAGRAM software with the ability to easily draw the Fishbone Diagrams (Ishikawa Diagrams) to clearly see the cause and effect analysis and also problem solving. The vector graphic diagrams produced using this solution can be used in whitepapers, presentations, datasheets, posters, and published technical material.
 Business Processes Area
Solutions of Business Processes area extend ConceptDraw DIAGRAM software with samples, templates and vector stencils libraries for drawing business process diagrams and flowcharts for business process management.
- Business Productivity Diagramming | SWOT and TOWS Matrix ...
- Fault Tree Analysis Diagrams | Business diagrams & Org Charts with ...
- Cause and Effect Analysis | Seven Management and Planning Tools ...
- Restaurant Floor Plans Samples | SWOT Sample in Computers ...
- HVAC Business Plan | How to Collaborate in Business via Skype ...
- Cafe and Restaurant Floor Plan | How to Design a Fast-Food ...
- Cafe and Restaurant Floor Plans | How To Create Restaurant Floor ...
- PROBLEM ANALYSIS . Root Cause Analysis Tree Diagram ...
- HVAC Business Plan | Online Collaboration via Skype | How to ...
- Fishbone Diagram | SWOT Analysis | Computer and Networks Area ...
- Strategy Plan Template Free Download
- How To Create Restaurant Floor Plan in Minutes | Cafe and ...
- Fishbone Diagram | Business Productivity Diagramming | Using ...
- Process Flow Diagram | How to Design a Fast-Food Restaurant ...
- How to Draw EPC Diagram Quickly | How To Create Restaurant ...
- Restaurant Floor Plans Samples | Café Floor Plan Example | How ...
- How To Create Restaurant Floor Plan in Minutes | Seating Plans ...
- SWOT Matrix Template | SWOT Analysis | SWOT Analysis | Swot Matrix
- Workflow Diagram Examples | Entity Relationship Diagram Software ...
- Root cause analysis tree diagram - Template | PROBLEM ...